Summary:
As previously discussed, being only data-driven can be a road to disaster for COVID-19 or supply chain management. To avoid this disaster requires skill sets from operations management (OM). In this blog we demonstrate that the probability a person actually has COVID-19 antibodies depends heavily on other factors besides the “raw data” of the test results. This well-known limitation is called the base rate fallacy and part of the OM area “Judgement Under Uncertainty” and the statistics area of Conditional probability.
If you test positive for COVID-19 antibodies, there is a good chance you do not have them:
Statistical Forensics – the danger of being data and not operations management driven.
Introduction:
As previously discussed, being only data-driven can be a road to disaster for COVID-19 or supply chain management (Importance of Operations Management to Overcome the Limitations of Data-Driven).
To avoid this disaster requires skill sets from operations management – in this case a real understanding of probability and statistics beyond paint by numbers. This blog will demonstrate this need by explaining why even if a person tests positive for COVID-19 antibodies, there may well be a very good chance this person does not have these antibodies and is still susceptible to being infected by the COVID-19 virus – Just Because You Test Positive for Antibodies Doesn’t Mean You Have Them.
Read More: Lessons for COVID-19 and Supply Chain Management Models
COVID-19 Testing
One of the most important topics for COVID-19 is testing. Two primary areas of testing are:
- Is a person currently COVID-19 positive?
- Does a person have COVID-19 antibodies?
In the first area of testing, various methods look to see if COVID-19 is active in the upper respiratory tract – it indicates a person’s current state. In the second area of testing, antibodies indicate a person previously had COVID-19, recovered, and now has some immunity to COVID-19. This is the result of an immune system response that first creates IgM (acute phase antibody) and then IgG (longer-lasting “convalescent” antibodies). For this blog we will focus on test 2 – antibody testing.
1 in 5 New Yorkers May Have Had Covid-19, Antibody Tests Suggest
F.D.A. Orders Companies to Submit Antibody Test Data
After Recovery from the Coronavirus, Most People Carry Antibodies
Two Types of Errors
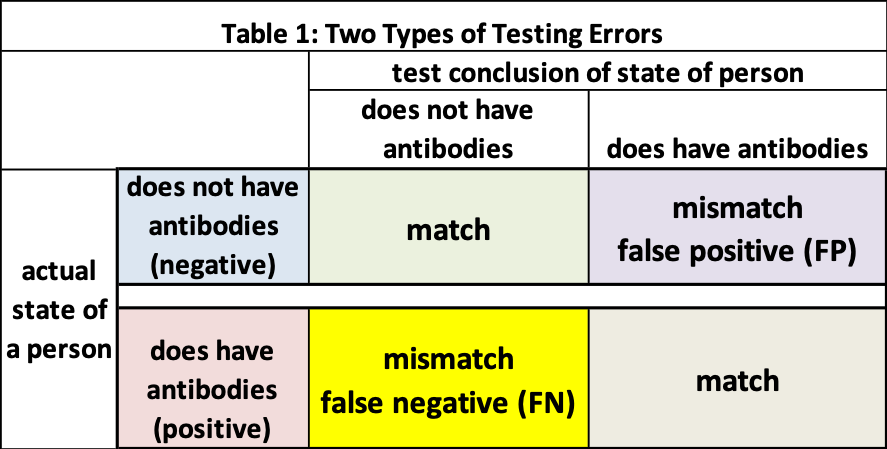
In any medical testing there are two types of errors:
- False Negative (FN): The test says you do not have a certain condition, when in fact you do. In this case the test says you do not have COVID-19 antibodies when in fact you do.
- False Positive (FP) – The test says you have a certain condition, when in fact you do not. In this case, the test says you have the COVID-19 antibodies, when in fact you do.
Table 1 illustrates the four possible combinations between a person’s actual state and what the test says. For the two green cells, the test status matches the actual status. The yellow cell is the false negative (FN), you have antibodies, but the test says no. The purple cell is a false positive. You do not have antibodies, but the test says you do. This is perhaps the most dangerous situation since the person believes they are immune to COVID-19, but they are not.
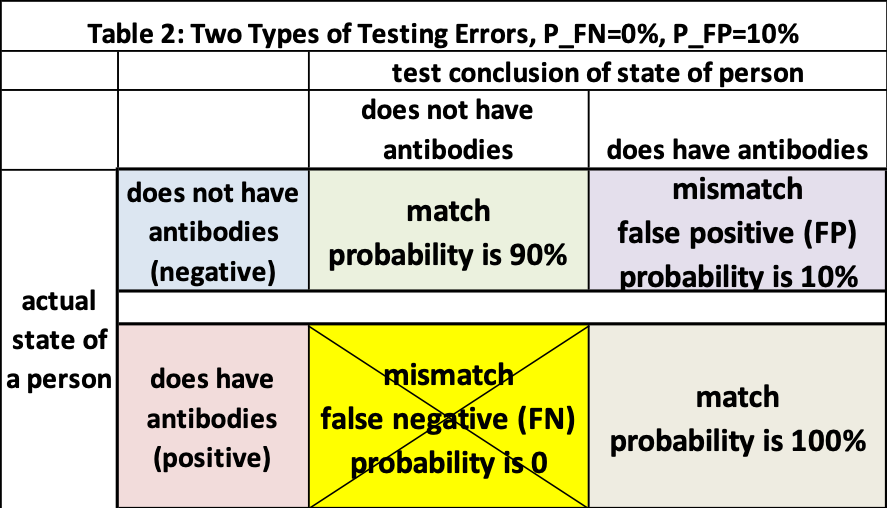
In the process of developing a test, the probability of an FN and FP is estimated following various protocols. For this example, we will set the probability of false-negative (P_FN) to be 0% and the probability of a false positive (P_FP) to be 10%.
- With P_FN=0%, this means if a person does have COVID-19 antibodies
- we are 100% certain the test will report a positive (match)
- and there is a 0% chance it will incorrectly report a negative (mismatch)
- there is no chance of a mismatch between a person’s actual status and test report
- With P_FP=10% if a person does not have COVID-19 antibodies
- there is a 90% chance this person will be reported as “no-antibodies” (match)
- but a 10% chance the test will report this person as “yes-antibodies” (mismatch).
- there is a 10% chance of a mismatch between a person’s actual status and test report
Table 2 adapts Table 1 for P_FN=0% and P_FP=10%. We observe if Person A tests positive for antibodies, there is some chance the person does not have the antibodies (purple cell in Table 2) and therefore can still be infected by COVID-19.
If a person tests positive for antibodies, what is the probability they have antibodies?
“Most people say about 90 percent, with the average answer being above 50 percent. This makes sense. After all, 90 percent accuracy is pretty high.” (Just Because You Test Positive for Antibodies Doesn’t Mean You Have Them)
The answer is it depends on the fraction of people with antibodies and without antibodies (true state) in the group or cohort that is being tested. This will be clearer with examples. For our example there are 900 people in our cohort, and we know exactly whether each person in the group did or did not have COVID-19 (and developed the antibodies).
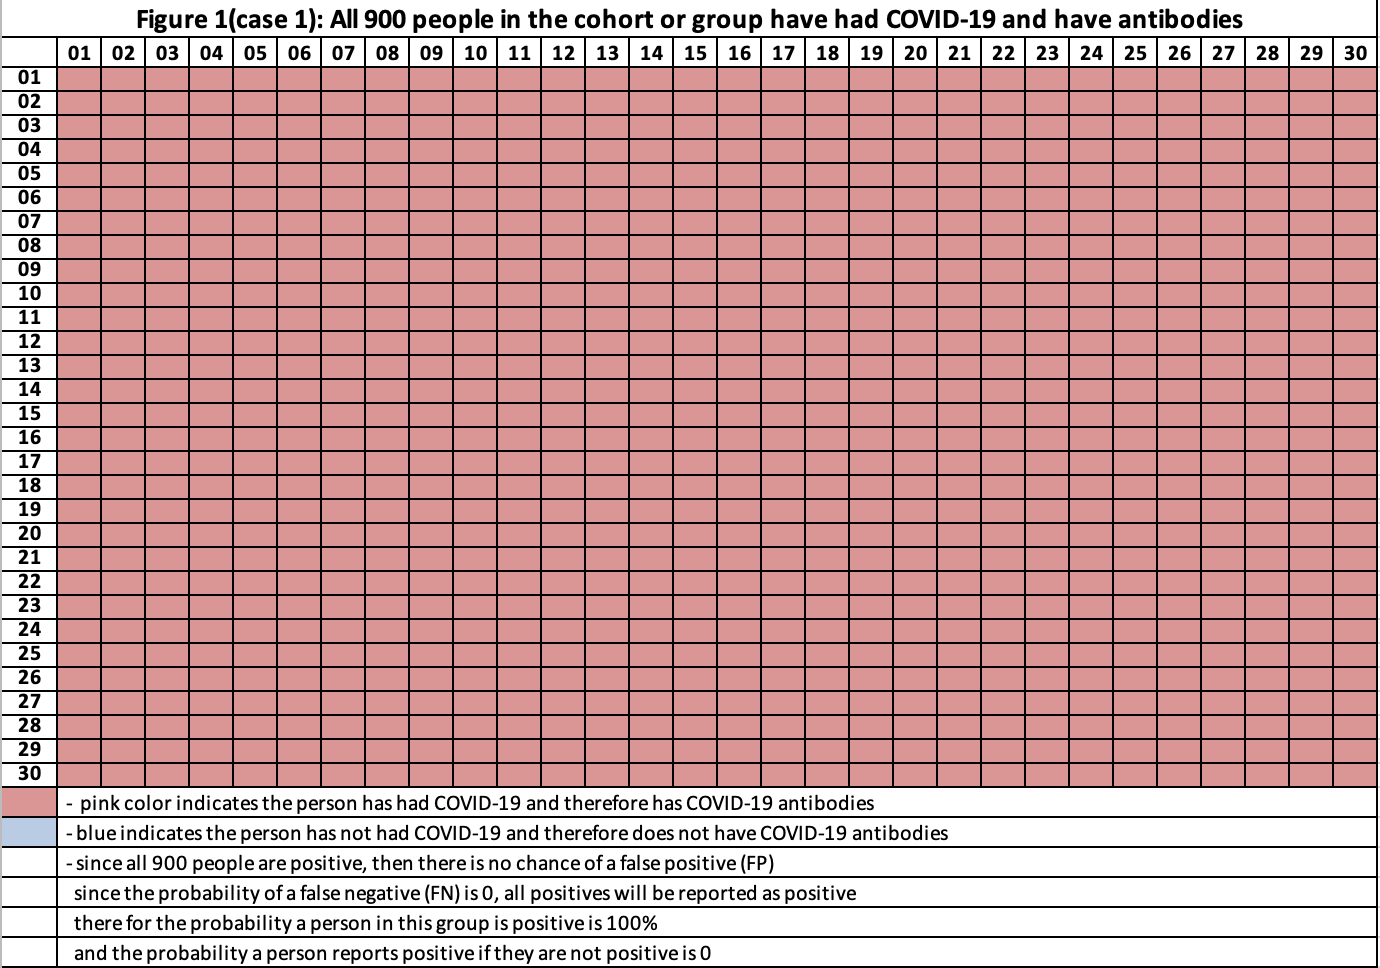
Case 1: All 900 people in the cohort have had COVID-19 and have antibodies (figure 1), therefore the probability that a selected person’s true state is “has antibodies” is 100%. Since P_FN is 0%, if a person tests positive, the chances this person is positive (for antibodies) is 100%.
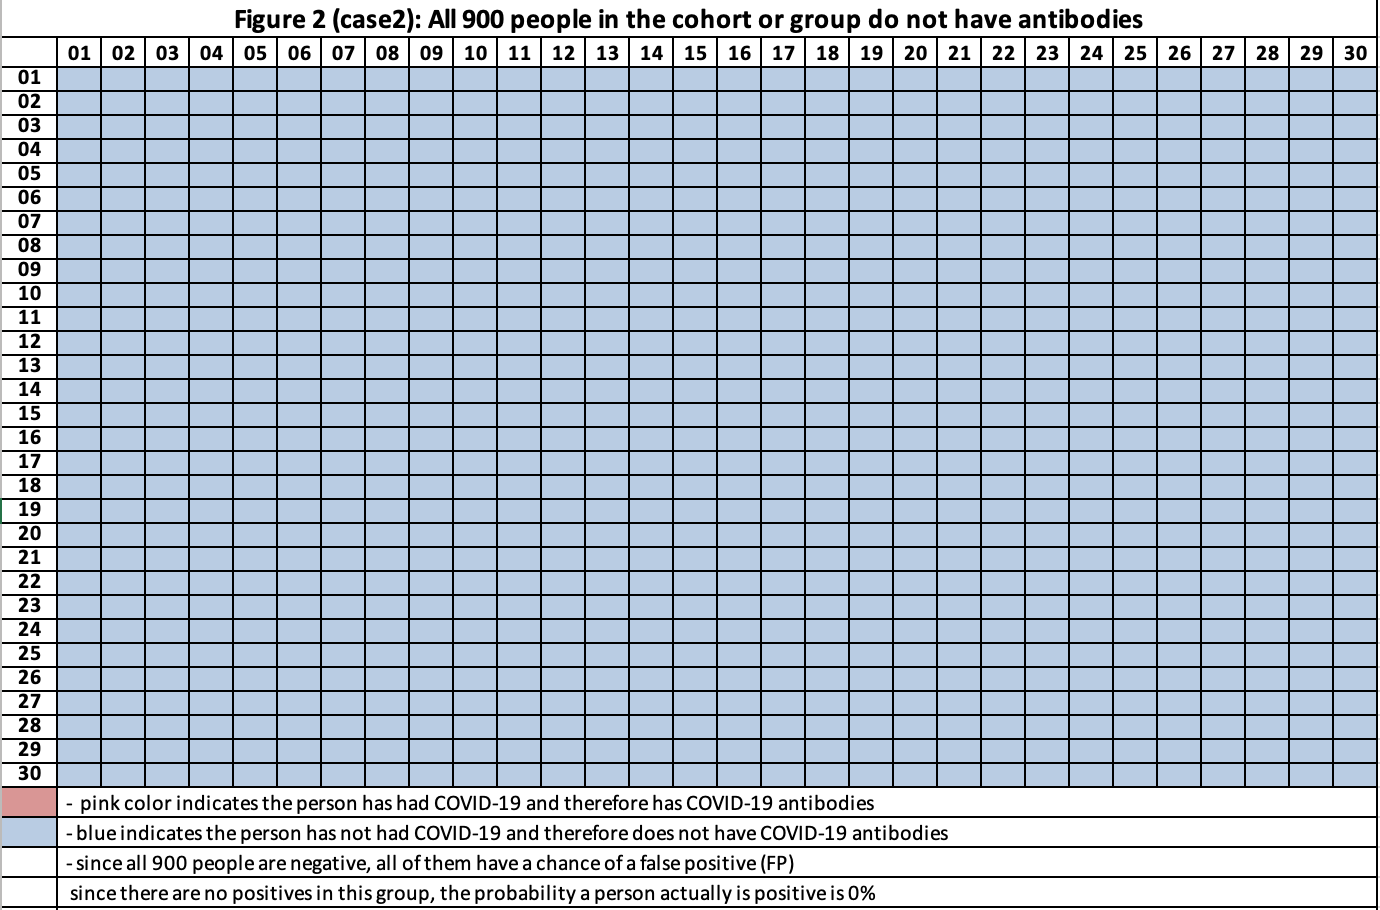
Case 2: All 900 people in the cohort have not had COVID-19 and do not have antibodies (figure 2). Therefore, if a person tests positive, the chance that this person is actually positive is 0%. If we applied the antibody test to everyone in the cohort, then on average 90 (=900 x 0.10) would test positive.
At this point we see the probability a person does have the antibodies and if this person tests positive varies dramatically based on the fraction of people whose actual state is positive or negative.
- In case 1 the chance the person is actually positive and if this person tests positive is 100%
- In case 2 the chance the person is actually positive and if this person tests positive is 0%
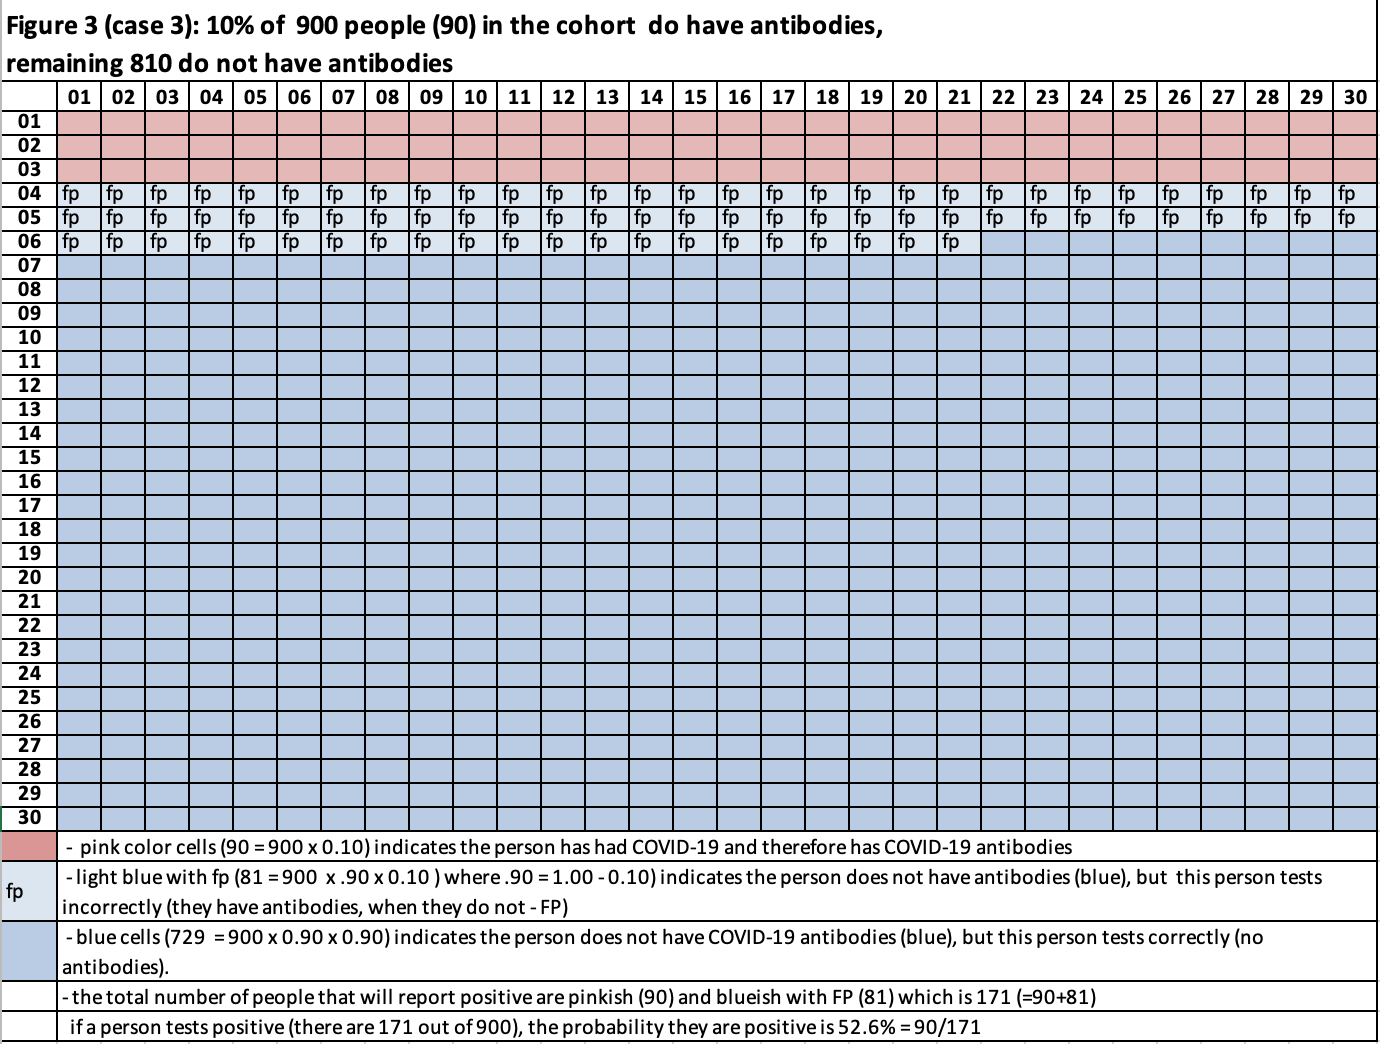
Case 3: See Figure 3. 10% of the cohort has antibodies (90=900 x 0.10 – pink), 90% do not have antibodies (810 = 900 x 0.90 – blue). Out of the 810 without antibodies, 10% will report having antibodies (false positive). This is 81 people (=810 x 0.10) and 90% will correctly report no antibodies (729 = 810 x 0.90). What is the probability a person is positive for antibodies if the test says they are positive for antibodies?
In figure3 the cells with just blue (729) are not players of interest. They will report the person is negative for antibodies. The cells with blue and FP (81 of them) and the pinkish cells (90) are players since both will report positive for antibodies, but only the pinkish cells are truly positive.
The chance for a person to be selected at random and be positive for antibodies is 19% (=171/900), where 171 = 90+81. If the person tests positive and is positive this probability is 52.6% (= 90 / 171).
Case 4: See figure 4. 5% of the cohort has antibodies (45=900 x 0.05), 95% do not have antibodies (855 = 900 x 0.95). Out of the 855 without antibodies, 10% will report a false positive (85.5=85 x 0.10) and 90% will correctly report no antibodies (769.5 = 855 x 0.90). What is the probability a person is positive for antibodies if the test says they are positive for antibodies?
In figure 4 the cells with just blue (769.5) are not players of interest. They will report the person is negative for antibodies. The cells with blue and FP (85.5 of them) and the pink cells (45) are players since both will report positive for antibodies, but only the pink cells are truly positive. The chance for a person to be selected at random and be positive for antibodies is 19% (=130.5/900), where 130.5 = 45+85.5. If the person tests positive and is positive this probability is 34.4% (= 45 / 130.5).
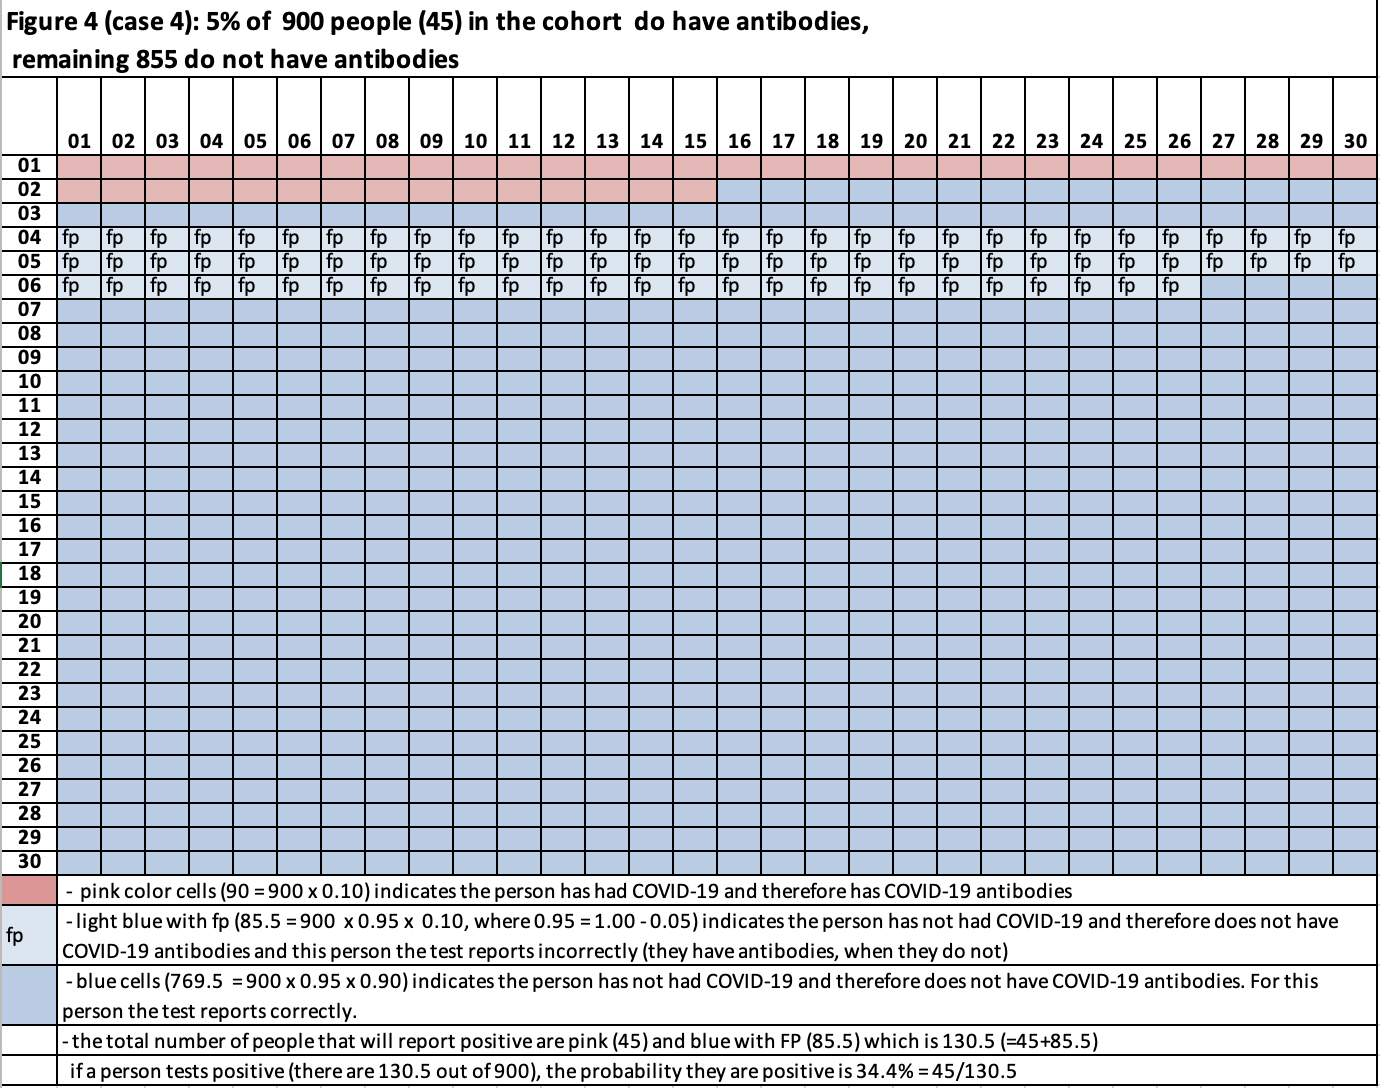
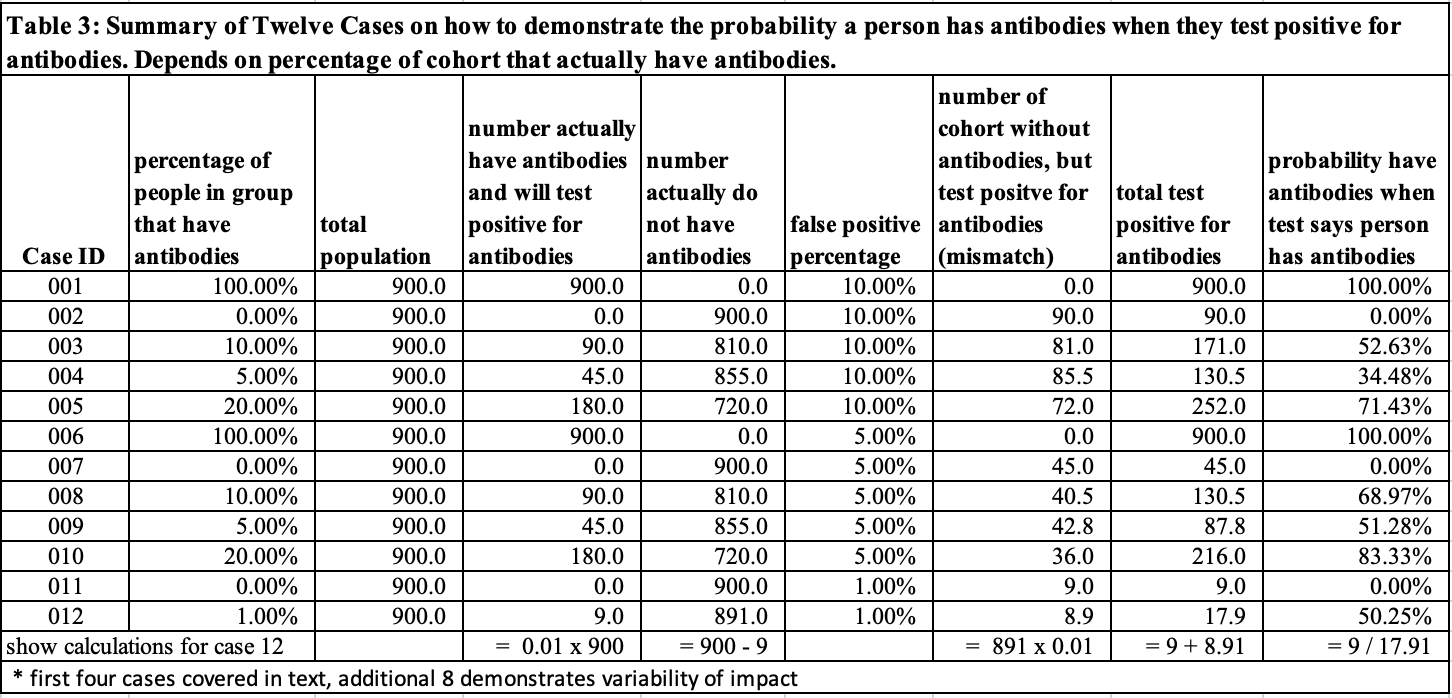
Table 3 summarizes the results of cases 1-4 and contains eight additional cases. In cases 6-10 the probability for a false positive (FP) is reduced to 5% from 10%. For cases, 11-12 FP is 1%. This demonstrates the probability a person who tests positive for COVID-19 antibodies and actually has COVID-19 antibodies is strongly influenced by the fraction of the population that actually has COVID-19 antibodies as well the strength of the test (the lower the probability of FP, the stronger the test).
Is There a Formula?
Yes, there is.
- PYA = probability a person actually has the antibodies
- PNA = probability a person actually does not has the antibodies = 1-PYA
- P_FP = probability of false positive
- A = PYA
- B = PNA x P_FP
- C = A + B
- A / C = probability person has antibodies when they test positive for antibodies
Conclusion
In the material presented in this blog, we have demonstrated data without being able to use best in class operations management (OM) structures can be dangerous. In this case, the probability a person actually has COVID-19 antibodies depends heavily on other factors besides the “raw data” of the test results. This well-known limitation of cognitive ability is called the base rate fallacy and is part of conditional probability. In OM this material is covered in “Judgement Under Uncertainty.”
Enjoyed this post? Subscribe or follow Arkieva on Linkedin, Twitter, and Facebook for blog updates.