Introduction
If you Google ‘Safety Stock Calculation’, you will find a myriad number of web pages providing various approaches to calculate Safety Stock. They range from the simplest method of multiplying your average daily sales over ‘x’ number of days with the lead time of the product to the theoretical and universally accepted method of using a normal distribution with uncertainty in demand and supply lead times.
Using normal distribution, Safety Stock is calculated as
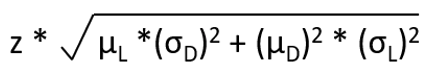
where,
Z = Normal function coefficient for given service level
µL = Expected value of lead time, assumed to be the mean lead time
(σD)2 = Variance of demand
µD = Expected value of demand, assumed to be the mean demand
(σL)2 = Variance of lead time
Learn More: Using Coefficient of Variation to Drive Safety Stock Related Decisions
The focus of this blog is to understand the different methods of calculating Demand Variance and how to decide which Demand Variance method should be used to calculate Safety Stock for a given SKU-location combination.
Method I: Using historical usage
Usage is nothing but the sum of customer shipments, interplant transfers, and consumption of a part (either for maintenance or repairs, to make a finished product, etc.) at a given location.
Demand variance can be easily calculated using the historical usage and here’s the formula –
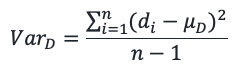
where,
n = Number of periods
di = Demand or Usage
µD = Mean demand
This variance is called Standard Demand Variance. This method of calculating variance can be used when
- Forecast is not available, or it is naïve
- Low variability in usage
Learn More: Relationship Between Forecast Accuracy and Safety Stocks
Method II: Using forecast error
Many organizations use forecasts for planning their business. When using forecasts for calculating Safety Stock, we need to account for the variability in forecast error instead of variability in demand as shown in Method I.
Variance of forecast error is calculated as
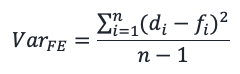
where,
n = Number of periods
di = Demand or Usage
fi = Forecast
This variance is called Standard Forecast Variance. This method of calculating variance can be used when
- Forecast error variability is low
- When the interplant transfers and the consumption component of Usage is forecasted. In such cases, the error between Usage and Forecast is reduced and hence the Variance.
A variant of the Standard Forecast Variance method is the Modified Forecast Variance which is calculated as
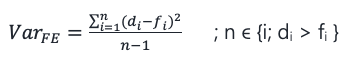
Here, the formula is the same as Standard Forecast Variance but applied only to periods when demand is more than the forecast assuming we want to keep a buffer only in cases where actual demand was higher than predicted as higher forecast will cover for variations.
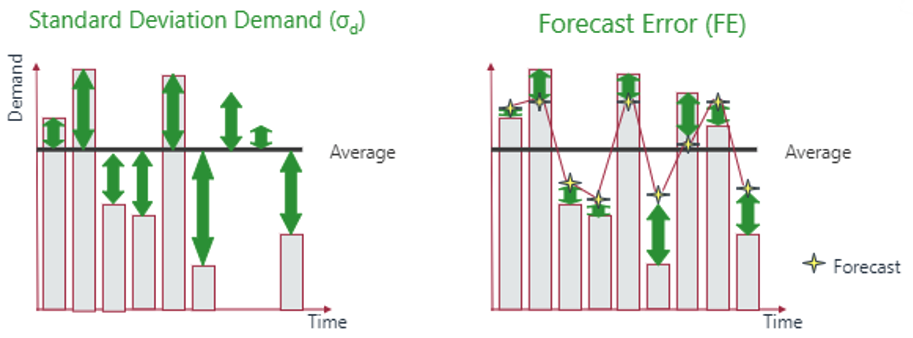
Let’s compare the Standard Demand Variance and the Standard Forecast Variance methods with actual data.
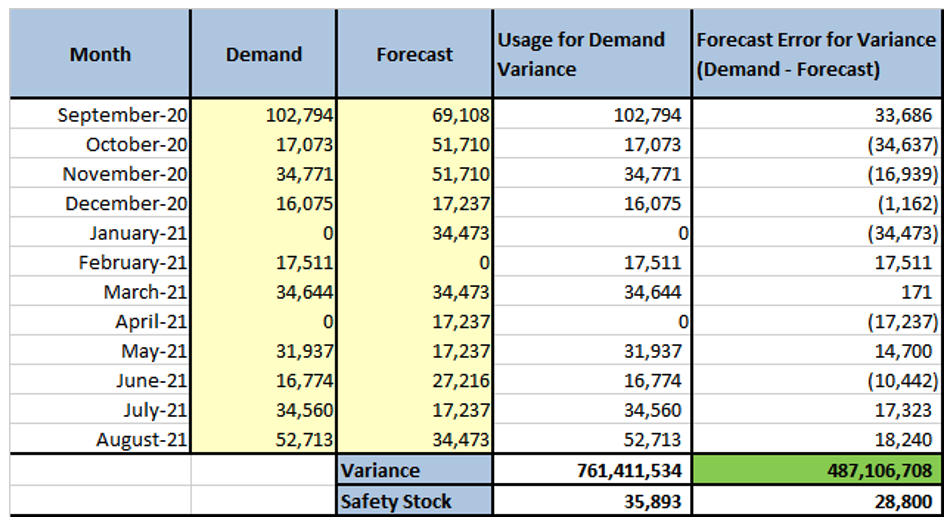
For the below data set, we calculated the Standard Demand Variance, Standard Forecast Variance, and the respective Safety Stocks using Arkieva’s Inventory Planner. Other inputs such as Service level, lead time, and lot size were kept the same for both of the methods.
Standard Demand Variance uses the Demand whereas Standard Forecast Variance uses the Forecast Error (Demand – Forecast) to calculate the Variance respectively.
Learn More: A Six-Step Process for Demystifying Your Safety Stock Process
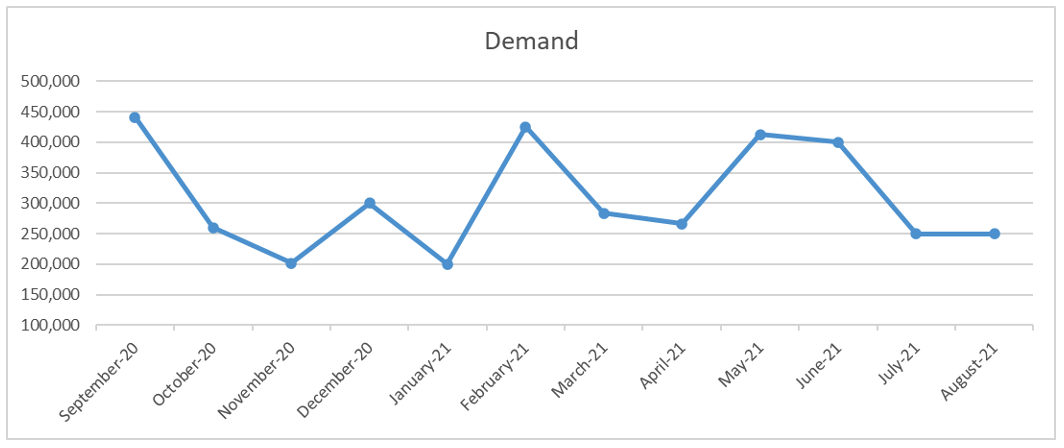
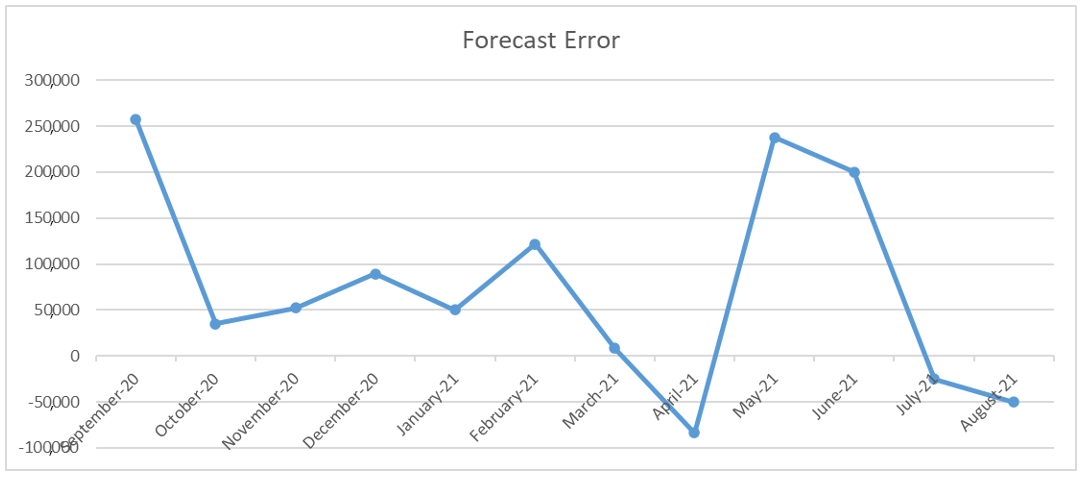
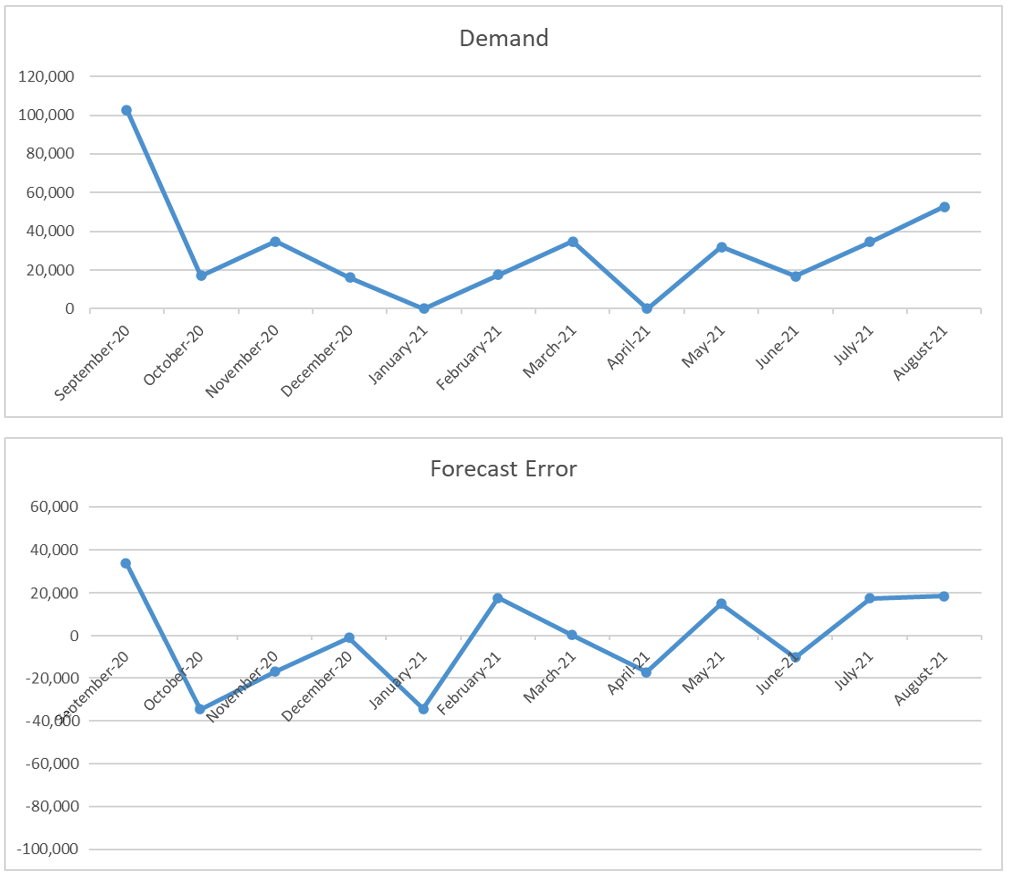
In this case, demand variance is less than forecast error variance (also visually evident from the charts) and hence is the Safety Stock.
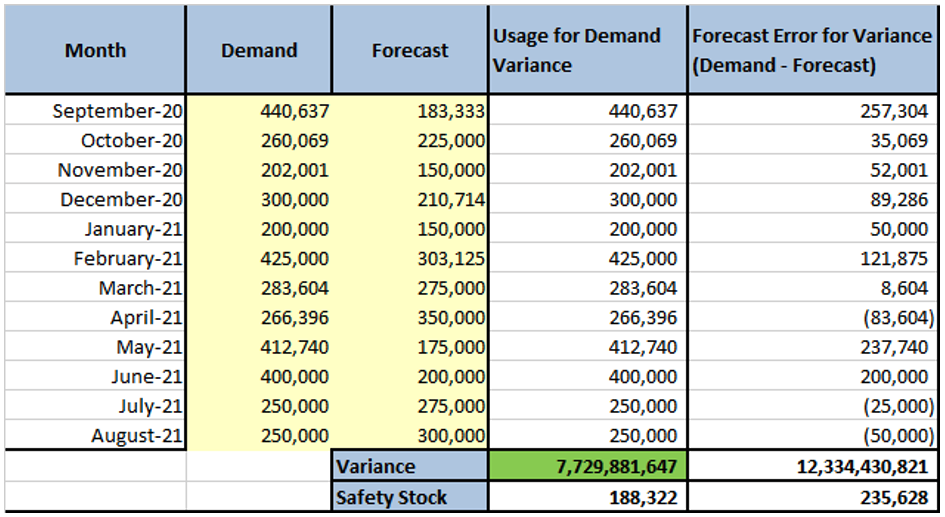
Visually also, demand is less variable than the forecast error.
For another data set we found the forecast error variance is less than the demand variance and so is the Safety Stock.
Again visually, Demand has more variability than the forecast error.
With these examples, we are not trying to come up with the best Variance method which gives the least Safety Stock and as a result, help save thousands of dollars, but this blog is an attempt to help Inventory Planners explore different methods available to calculate Demand Variance and decide which method is best suited for their products and businesses. Remember, in supply chain planning, there is no “one size fits all”.
Enjoyed this post? Subscribe or follow Arkieva on Linkedin, Twitter, and Facebook for blog updates.