
Do others challenge your safety stock selections? Are you in need of a safety stock process or policy? Want to take the drama out of your safety stock process?
Use this collaborative six-step process to demystify your safety stock process and create buy-in.
- Offer multiple calculations of safety stock
- Add descriptive statistics for the data element of inventory: Item-Location
- Review with Planners and Sales for realism
- Negotiate
- Use Excel Pivot Tables to check levels
- Rinse and repeat every 90 days
Note: In these examples, I’ll show how these calculations can be achieved using Excel. For larger datasets, using a planning software solution might make the calculation and analysis process less cumbersome.
Read More: Another Descriptive Statistic for managing inventory
1) Offer multiple calculations
There are several methods for calculating safety stocks, such as a period of supply and statistical safety stock. These are all sound methods to arrive at a safety stock value, however, think of others that are available.
- Download shipment history to Excel and determine the 12-month MAX. Safety Stock is then equal to MAX 12 – Forecast. When this turns negative with strong sales projected, you turn to the methods above. However, with stable products, this easily understood method gives a reasonable buffer to protect against the highest demand seen in a 12-month period.
- Use the LARGE function in Excel to factor the expression (MAX 12 – Forecast). For 80% of the MAX 12 = 0.8*(LARGE Array, 1) where 1 is the largest value in the array. You can also choose the second largest value and so on as well as change the factor, 0.8 to other numbers.
- MAXddlt : Calculate the maximum demand in a lead time period every day or every week using the sum function in Excel. Continue using MAXddlt – Forecast as above. Note: When the maximum demand is exceeded in a lead time period, you find yourself at the lead time fence for which you can make a change with no lead time compression.
- Adjust for lead time using the factor: (Lead Time/Forecast Interval)5
- Choose two or three of these methods that best fits your business and consider taking the minimum calculation to start the conversation as you present to Planners and Sales.
2) Add descriptive statistics
To give meaning to the safety stock presented for review, apply relevant descriptive statistics alongside the safety stock calculation. This provides grounding for the reviewers.
- Show product families, warehouse, who buys, and basic product descriptions. In addition, display these descriptive statistics mentioned in previous blogs, at the data element item-location:
- ABC code from Product/Customer Matrix
- Coefficient of Variation >>COV<<(Std Dev/Mean): from the variability of the demand stream
- Average Demand Interval >>ADI<<(12/No. of months sold in a 12-month period)
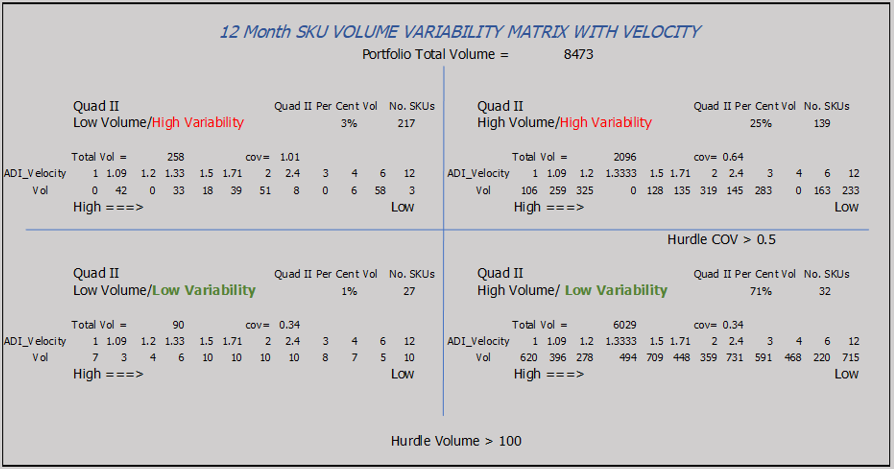
- Volume/Variability Matrix: Negotiate a ‘hurdle rate’, or threshold for monthly sales by product family and a COV ‘hurdle rate’ (typically 0.3 or 0.5). See Fig. 1 for an example.
Fig. 1 Volume Variability Matrix to label safety stock quadrants
If you consider the above minimum essential, then customize with the following, at the SKU level:
- Show last three months of shipments alongside next three months of forecast
- List strategic customers buying
- List the number of ship to customers
- Show stock out history (keep a record of weekly stock outs and calculate frequency: No. of stock outs/No. of weeks)
- Months of inventory from weekly reporting (decide on what level is ‘too much’, ‘too little’ or ‘just right’.
- Create your own bespoke statistics to fit your business whatever it may be
Read More: How to Track Your Inventory Stock Out Levels Using These Severity Codes & Alerts
3) Review with Planner and Sales for realism
Compile the above data in an Excel spreadsheet, create a Sales/Planner team for review, and fend off all challenges with descriptive statistics. Here’s some you might face:
- If the SKU has an ADI of 6, in Quad III, and they want more safety stock, you might want to ask why invest in a product that sells every 6 months with high variability and low volume.
- If the product shows no shipments in the past 12 months, why add safety stock if we hold inventory of the phase-out product?
- For SKUs in Quad I with low variability and steady production, do we really need lots of inventory?
4) Negotiate
No matter how sophisticated your analytics, NEVER ignore Market Intelligence. When Sales wants more safety stock of that SKU with an ADI of 6, it could be because they landed a new contract. Likewise, for an SKU with no sales. And when a Quad I appear steady; the Planner might know the strategic customer will soon be leaving.
5) Use Excel pivot tables to check levels
Become a ‘Pivoteer’ and show safety stocks in volume and dollars (Cost of Goods Sold) by groups of:
- Product family
- Strategic Customers
- Quadrants (I-II-III-IV)
- High Volume (Quads I & II) – Low Volume (Quads III & IV) – High Variability (Quads II & III) and Low Variability (Quads I & IV)
- Frequency of Stock Outs
- Warehouse
- SKU and Ship to Customer combination
- Your bespoke set of descriptive statistics
Read More: ABC Segmentation for Inventory Management
6) Rinse and Repeat every 90 days
Things happen as you’ll soon find out from Market Intelligence (its not an oxymoron). You need to keep up with the changes in the market place and create realistic safety stock your team can agree upon. 90 days may not fit your business, so consider every lead time period at least.
Which of the steps is most difficult?
Step 3 by far. You need to create buy-in for this important process. Safety Stocks support sales, so you need their recognition of responsibility. Emphasize the importance by using the language of business (dollars) and create buy-in. Monitor results, stay committed, stay disciplined and others will follow.
Note: Apply these descriptive statistics for your Product Manager to prune the portfolio. Can you quantify what makes a “good SKU” from a “bad SKU”? Stay tuned…
Enjoyed this post? Subscribe or follow Arkieva on Linkedin, Twitter, and Facebook for blog updates.