Summary
The risk of viruses is often a topic of conversation in current times. One of the dominant questions at social gatherings is – what is a bigger risk (defined as serious illness) this fall and winter: regular virus (REGVIR) or COVID-19. To answer this question requires combining the probability of getting the virus with the probability of becoming ill if you get the virus. As pointed out in previous blogs, being data-driven can lead to large disasters without the application of operations management (OM) methods.
Statistical Forensics – The Danger of Being Data and Not Operations Management Driven
Lessons for COVID-19 and Supply Chain Management Models
In this blog, we will demonstrate why and how to combine these probabilities and make clear the KISS (keep it simple stupid) path when being data-driven can lead to the wrong understanding of a complex situation potentially resulting in a disaster.
Introduction
The risk of viruses is often a topic of conversation in current times. One of the dominant questions at social gatherings is – what is a bigger risk (defined as serious illness) to an individual this fall and winter: option 1 – “regular virus” (REGVIR) or option 2 the “COVID-19” virus. Never in my wildest dreams would I have thought probability and data analytics would catch this much attention. To answer this question, we need to understand how to combine probabilities. This blog will make clear how to do this and an intuitive understanding of why it is true. Combining probabilities correctly is a critical concept at the core of most of the machine learning methods that are useful in supply chain management.
Problem Basics
Through various analytical methods public health officials determine:
- The probability that a person will get seriously ill, if they get COVID-19 is 200 chances in 1000 which is 20% = 0.20.
- The probability that a person will get seriously ill, if they get REGVIR is 50 chance in 1000 which is 5.0% = 0.05.
With this information, one might assume the risk is much greater from COVID-19 – 20% versus 5%. However, a second component of the problem is the probability of getting COVID-19 or REGVIR. If a person’s chance of getting COVID-19 was ZERO, then the risk from COVID-19 is ZERO. If a person’s chance of getting COVID-19 is 100% (everyone gets it), then the chance of serious illness is 20%. We need two additional pieces of information:
- The probability that a person actually gets COVID-19. For this example, we will assume 10%.
- The probability that a person actually gets REGVIR. For this example, we will assume 50%.
Determining the real risk from COVID-19
The number of people in our group or cohort is 900. Figure 1 shows them in a 30 by 30 grid, each one has a number. Each cell is green, for now, none of them have COVID-19.
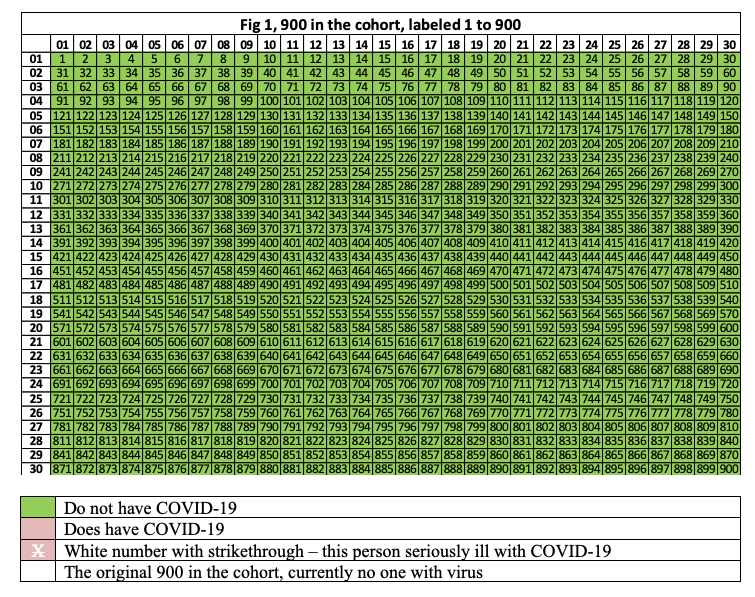
Figure 2 demonstrates the effect of 10% of them getting COVID-19. The cells colored pink have COVID-19. There are 90 pink cells, where 90 = 10% x 900. Even if all the COVID-19 people in the group got seriously ill, the maximum risk is 90 out of 900 which is 10 out of 100 = 10%.
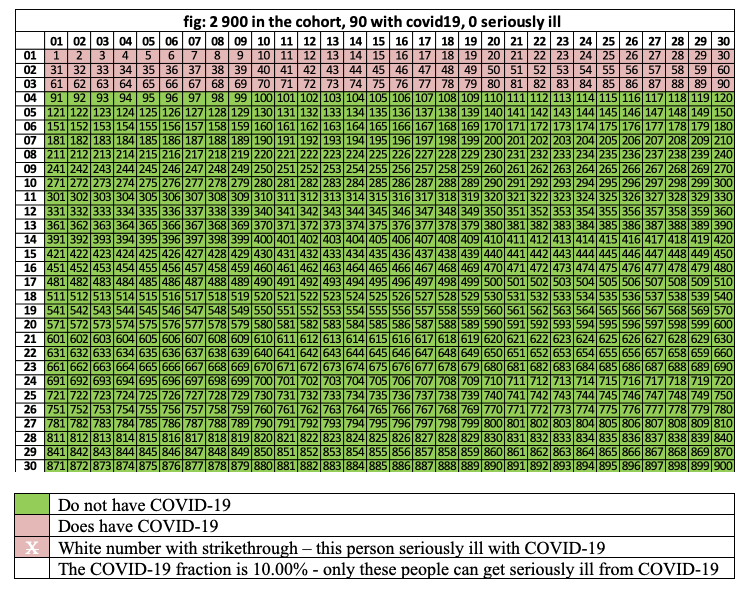
Figure 3 demonstrates the effect when 20% of the 90 people with COVID-19 get seriously ill. These people are in pink cells where the numbers are white with a strikethrough. There are 18 people in this group. 18 = 20% x 90 = 20% x (10% x 900) = 20% x 10% x 900 = 2% x 900.
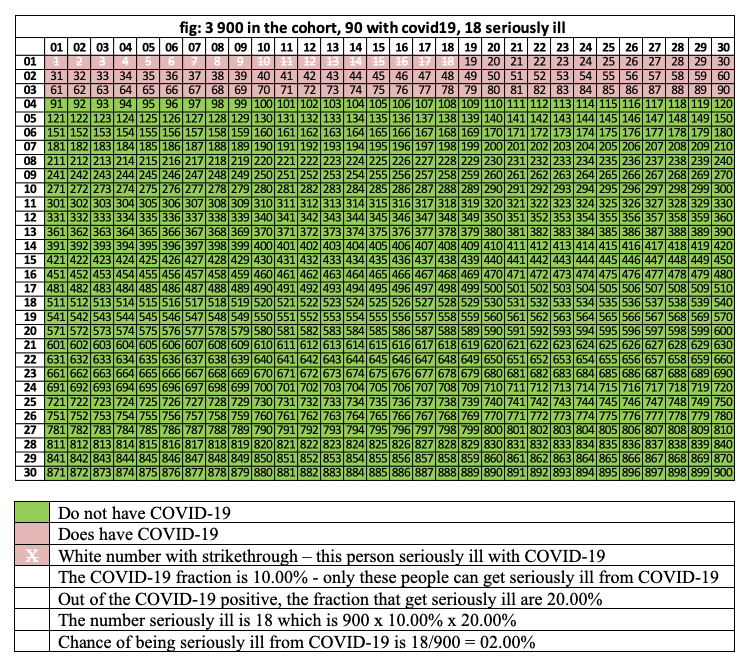
The real risk of getting seriously ill from COVID-19 is 18/900 = 2%. Yes, we could apply the short cut of multiplying 20% x 10%.
Determining the real risk from REGVIR
We apply the logic from COVID-19 to the grid in Figure 1 for REGVIR.
Figure 4 demonstrates the effect of 50% of them getting REGVIR. The cells colored pink have REGVIR. There are 450 pink cells, where 4500 = 15% x 900. Even if all the COVID-19 people in the group got seriously ill, the maximum risk is 450 out of 900 which is 50 out of 100 = 50%.
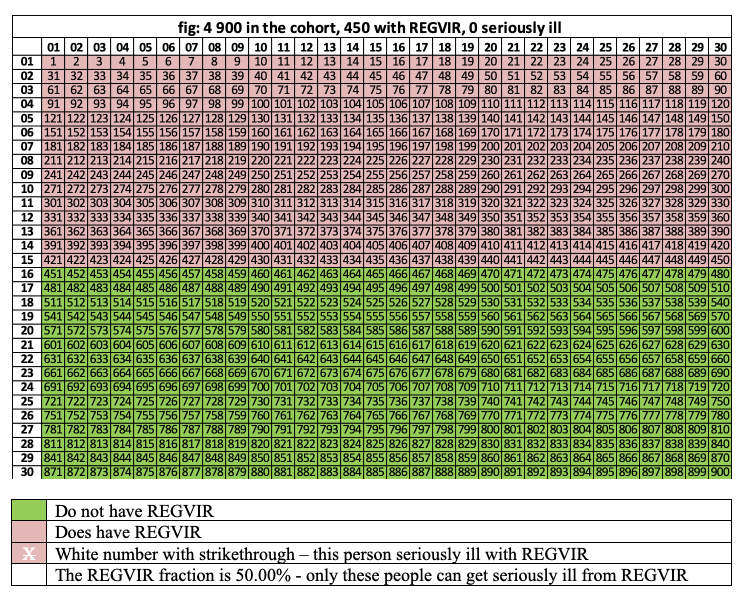
Figure 5 demonstrates the effect when 5% of the 450 people with REGVIR get seriously ill. These people are in pink cells where the numbers are white with a strikethrough. There are 23 (22.5, I rounded to 23) people in this group. 22.5 = 5% x 450 = 5% x (50% x 900) = 5% x 50% x 900 = 2.5% x 900.
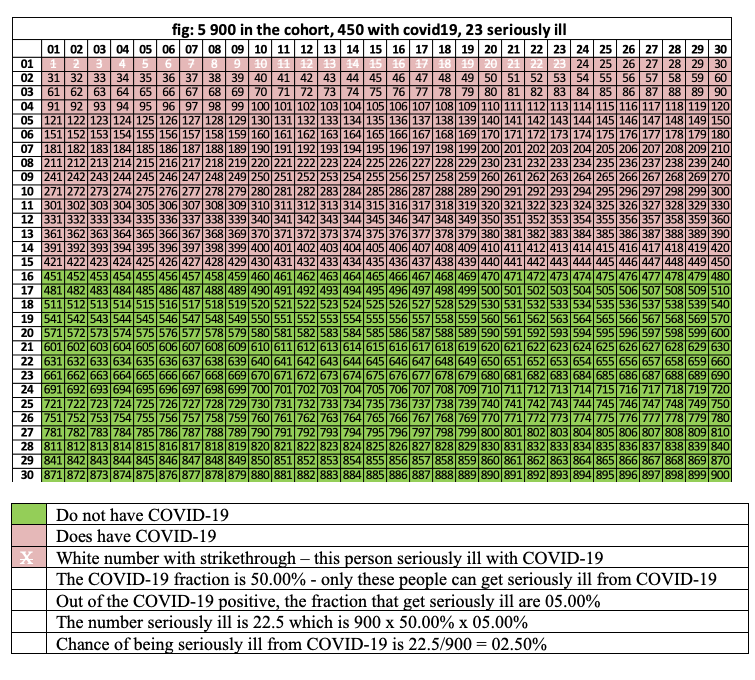
The real risk of getting seriously ill from REGVIR is 22.5/900 = 2.5%. Yes, we could apply the short cut of multiplying 5% x 50%. The real risk of REGVIR is higher than COVID-19.
Generalizing the Rules for Finding Real Risk
The risk of getting seriously ill from either virus has two components
- The probability getting the virus – call this PHV – “probability have virus”
- If you get the virus, the probability of becoming seriously ill from the virus – call this PIIVH – “probability ill if have virus”. This is called a conditional probability.
Learn More: Conditional Probability Made Easy – Heart of Machine Learning
The risk is the probability of being ill from having the virus – call this PIFV – requires combining the two individual probabilities. PIFV = PHV x PIIVH
- For COVID-19
- PHV = 10%
- PIIVH = 20%
- PIFV = 2% = 10% x 20%
- For “REGVIR”
- PHV = 50%
- PIIVH = 5%
- PIFV = 2.5% = 50% x 5%
Conclusion
As pointed out in previous blogs, being data-driven can lead to large disasters without the application of operations management (OM) methods to help guide decisions. This includes methods from statistical forensics. In this example, we have demonstrated using the probability of becoming seriously ill from a virus (a conditional probability) by itself can lead an organization down the wrong path. It has to be appropriately balanced with its partner – the probability of actually getting the virus. In this example, the probability of getting the virus (either COVID-19 or the regular virus) is a value that does not change over time. In practice this is not true, both can quickly show exponential growth if no actions are taken to limit the spread. The key concept for exponential growth is the number of cases tomorrow depends on the number of cases today.
Enjoyed this post? Subscribe or follow Arkieva on Linkedin, Twitter, and Facebook for blog updates.


