In this series of blog posts, we have been talking about Jane who is in the role of inventory planner at her company. Kate, who is a consultant, has been helping Jane with the concepts related to safety stock.
Catch up on the first 6 parts: part 1, part 2, part 3, part 4, part 5 and part 6.
Jane said, “I want you to explain variance and standard deviation. How are they related to each other and the input on which they are calculated? Also, I have a question about the service level. I am confused by how you described it.”
Kate replied, “OK. Let us look at variance first. Let us take an example to understand the concept. Say you are face to face with a river, and you do not know how to swim. Now, if someone said that the water is on average 3 feet deep, would you be willing to walk across?”
Jane said, “Well, I would be more worried about the deepest point and not the average if I did not know how to swim. And I would also worry about what is in the water.”
Kate smiled and said, “Let us ignore any water creatures for the moment. You are right. What if the river was only inches deep in some locations, and 10+ feet deep in other locations? That would not be good for someone who cannot swim.”
“Variance is a way to measure this variation from the average or the mean. Sometimes we also call this variation the spread around the mean. The lower the spread, the smaller the calculated variance.”
“Now, you may be wondering how it is calculated. It is quite easy. Calculate the mean or the average, then subtract the mean from each data point. Because this difference can be positive or negative, and we do not want these to cancel each other out, you square each term. Add all the square terms, then divide by the number of terms, n. Here is what the formula looks like.”
Kate wrote on the whiteboard:
Variance (σ2)= SUM(xi – x̄)2/n, where
- xi is any individual data point,
- x̄ is the mean or the average, and
- n is the number of observations.
Kate said, “Fortunately, there is a formula in MS Excel that you can use to calculate this. Also, the standard deviation (σ) is simply the square root of the variance.”
Kate continued, “It is good to know a couple of properties of variance. For one, the units would be the square of units of the input. Standard deviation, on the other hand, has the same units as the input quantity. So, in the example of the river, if the depth of the river is measured in feet, then the unit of measure of standard deviation is also feet. The unit of variance of the variance will be feet2.”
“Also, variances of independent quantities can be added as long as the unit of measure is the same. In fact, we will use this property in the calculation of safety stocks.”
Jane said, “I will think about it some more but it does make sense.”
Kate said, “Good. What was your question related to the service level?”
Jane said, “Well, in the picture that you showed, you said that points D, E, and F are equivalent because they all have a stockout. I can see why there will be a stockout if the demand is at those three points. However, it seems D is better than E, which in turn is better than F as a smaller portion of the demand will be unmet in these three situations respectively.”
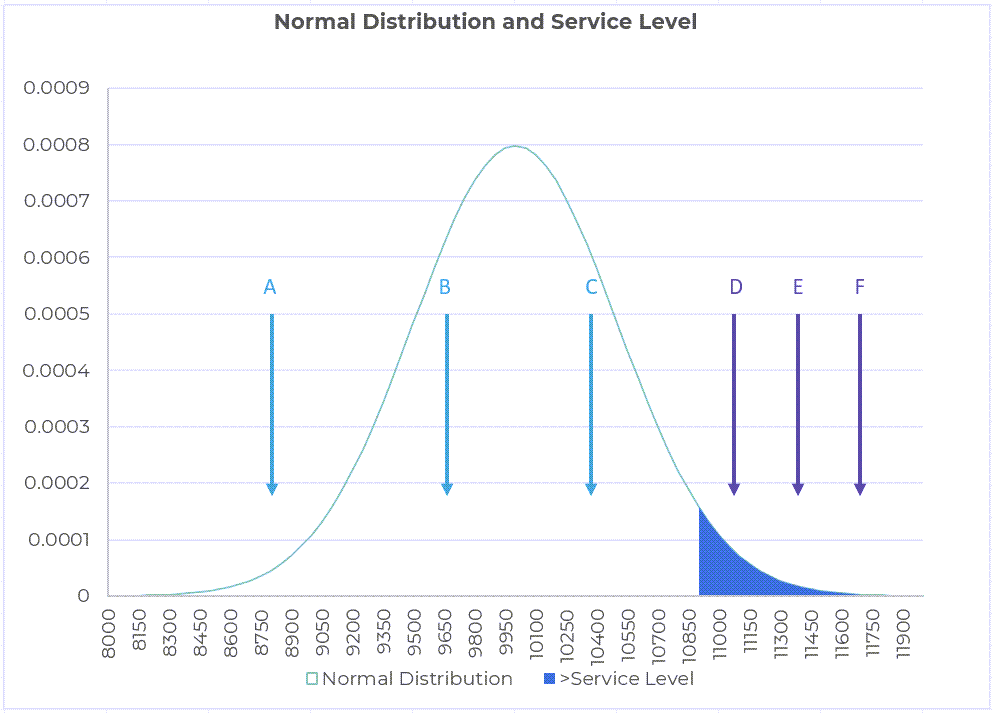
Click to enlarge
Kate smiled and said, “That is a great observation and question, Jane. In fact, those are different ways of measuring the service level. The first way, where we are only interested in the binary question of whether there will be a stock out, is called the cycle service level. The second way, in which we are concerned with the percentage of demand that can be satisfied before the stockout, is called the fill rate service level. The safety stock formula that we are currently discussing is based on the cycle service level. I suppose we can discuss the formula based on the fill rate service level later”.
“Sounds like a plan,” said Jane.

Read the next blog in the series here.