Missed the beginning of the series? Catch up on part 1, part 2 and part 3.
In this series of blog posts, we have been talking about Jane who is in the role of inventory planner at her company.
Supply Lead Time
After coaching Jane on the importance of lead time and standard deviation when calculating safety stock, Kate focused on the supply lead time. This is shown in Figure 1 below.
Figure 1
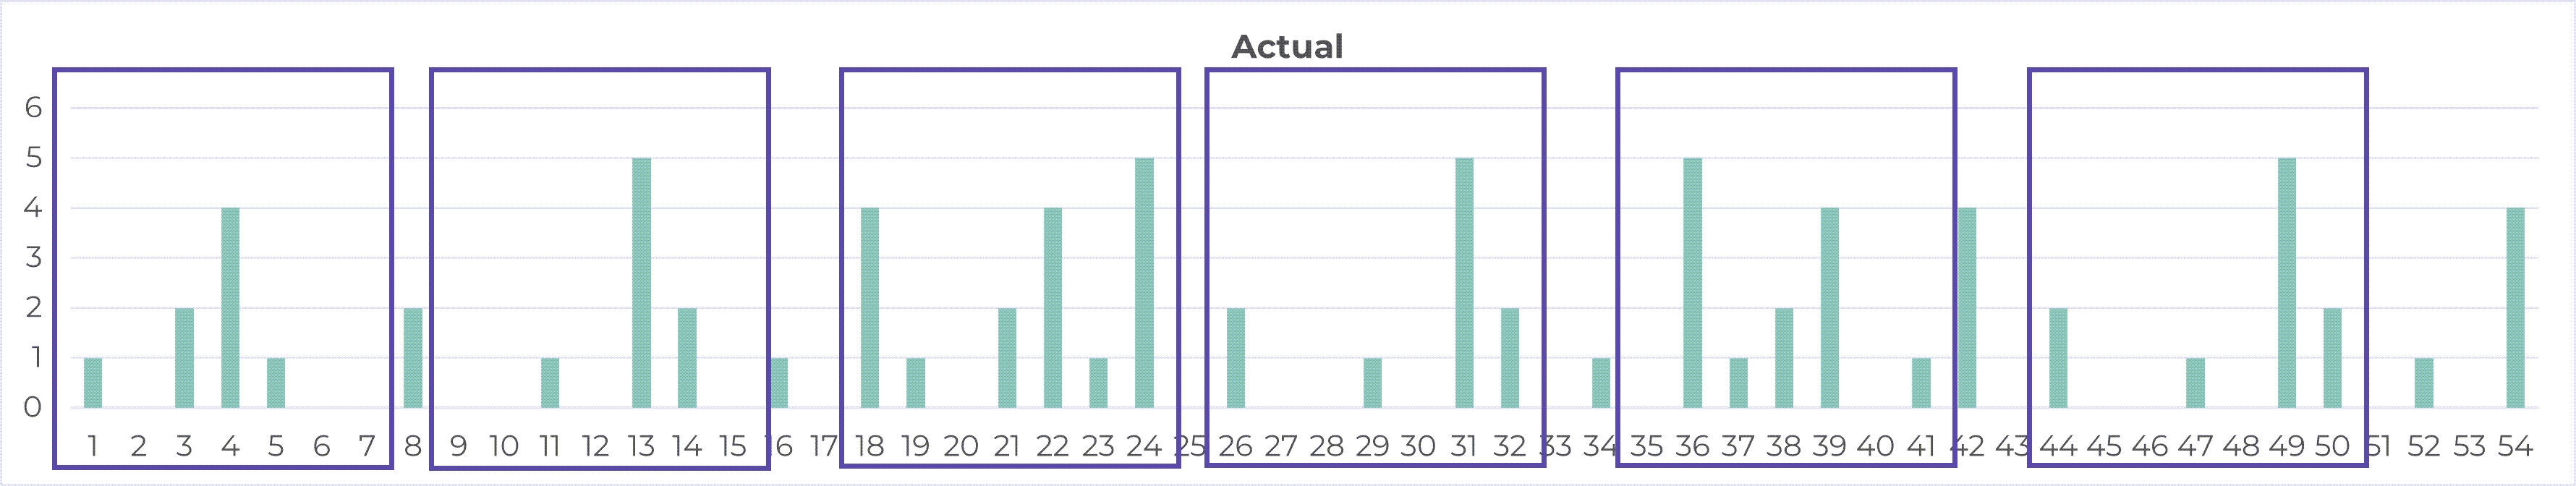
Click to enlarge
Grouping the data this way resulted in an average of 10.2 and a standard deviation of 2.91. (See Figure 2.)
Figure 2
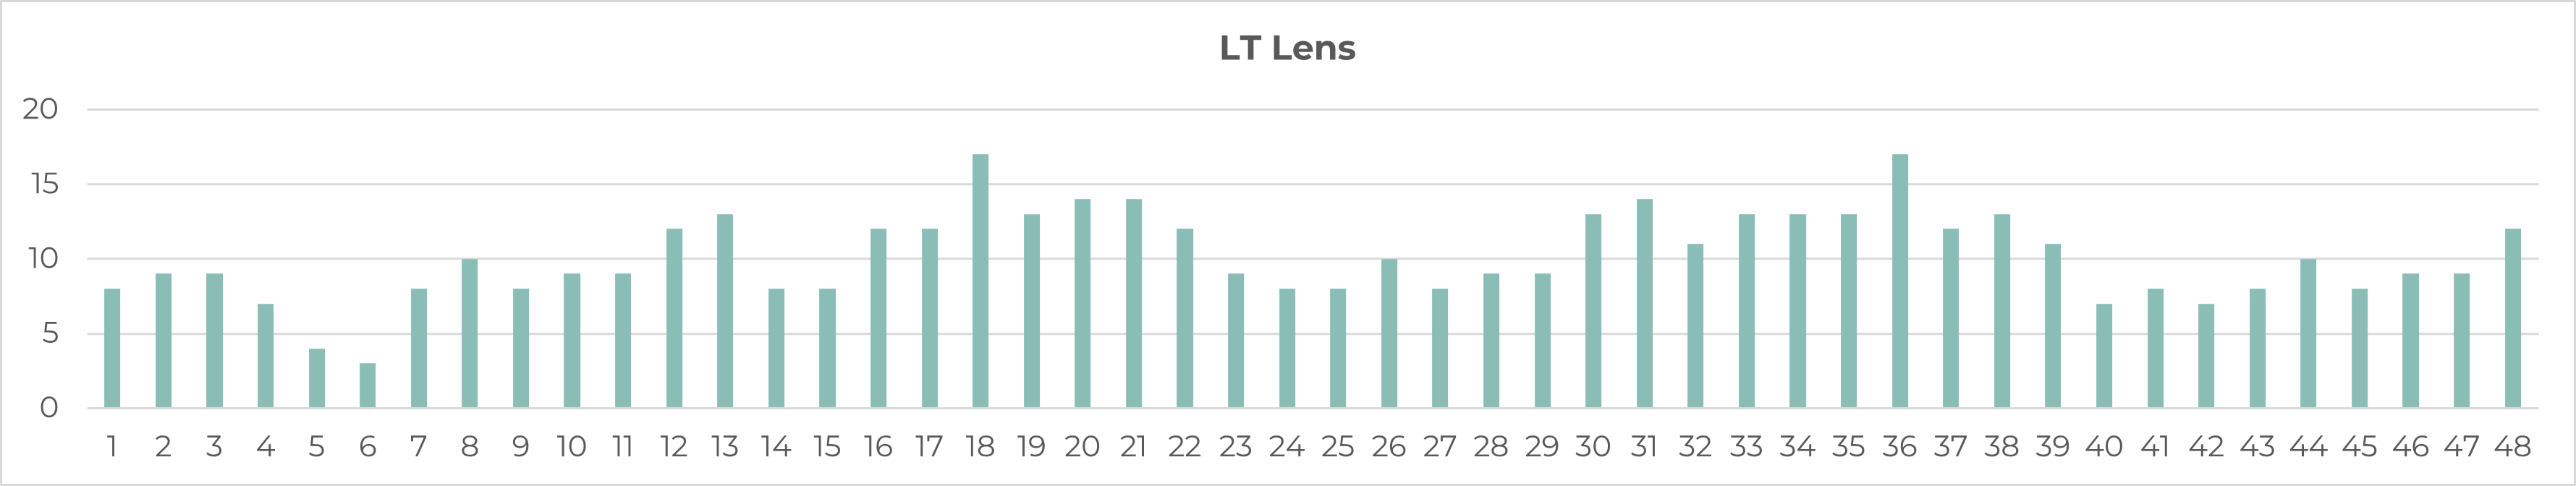
Click to enlarge
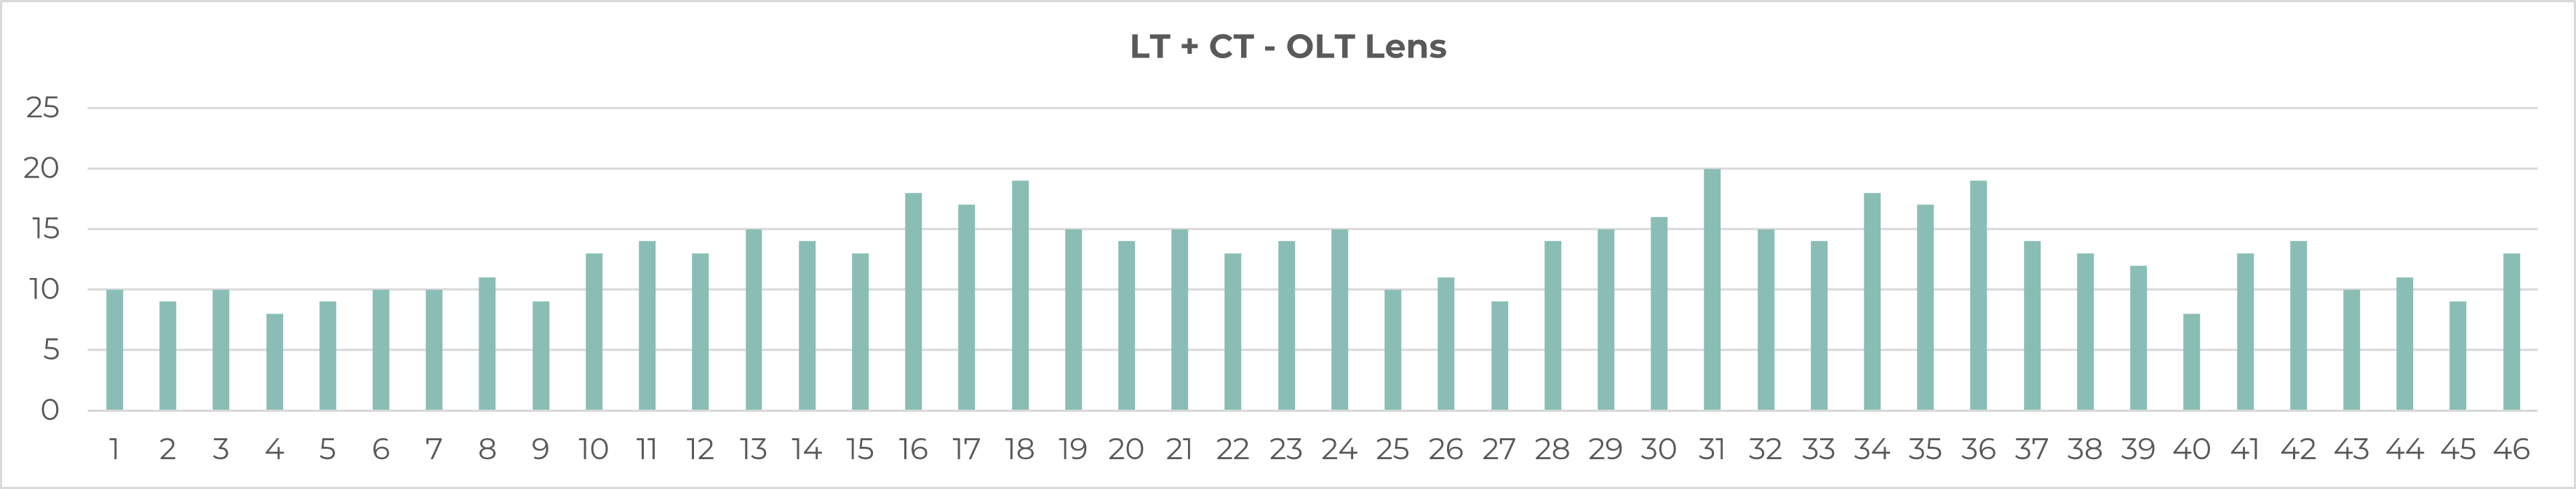
Kate suggested that the lead time required at least two more adjustments. One had to do with the periodic or schedule-based nature of the supplies. Suppose the lead time was 7 days, but it came on ships that operated on a 10-day schedule, or it was produced at the plant once every 10 days and it was not possible to break into the schedule. In such a case, the business needed to worry about and account for the variability over the two-week gap in the shipping schedule plus the lead time. Kate explained it to Jane this way: Suppose one of the ships carrying the product just left the supplier. That ship would arrive in 7 days. However, the next time one can get any new (not yet ordered) supply would be 10 + 7 = 17 days. Therefore, one needs to account for the full 17 days (supply lead time + supply cycle time).
Looking at the demand with a lens that wide looks like Figure 3.
Figure 3
Click to enlarge
Grouping the data this way resulted in an average of 25.07 and a standard deviation of 3.69. (See Figure 4.)
Figure 4
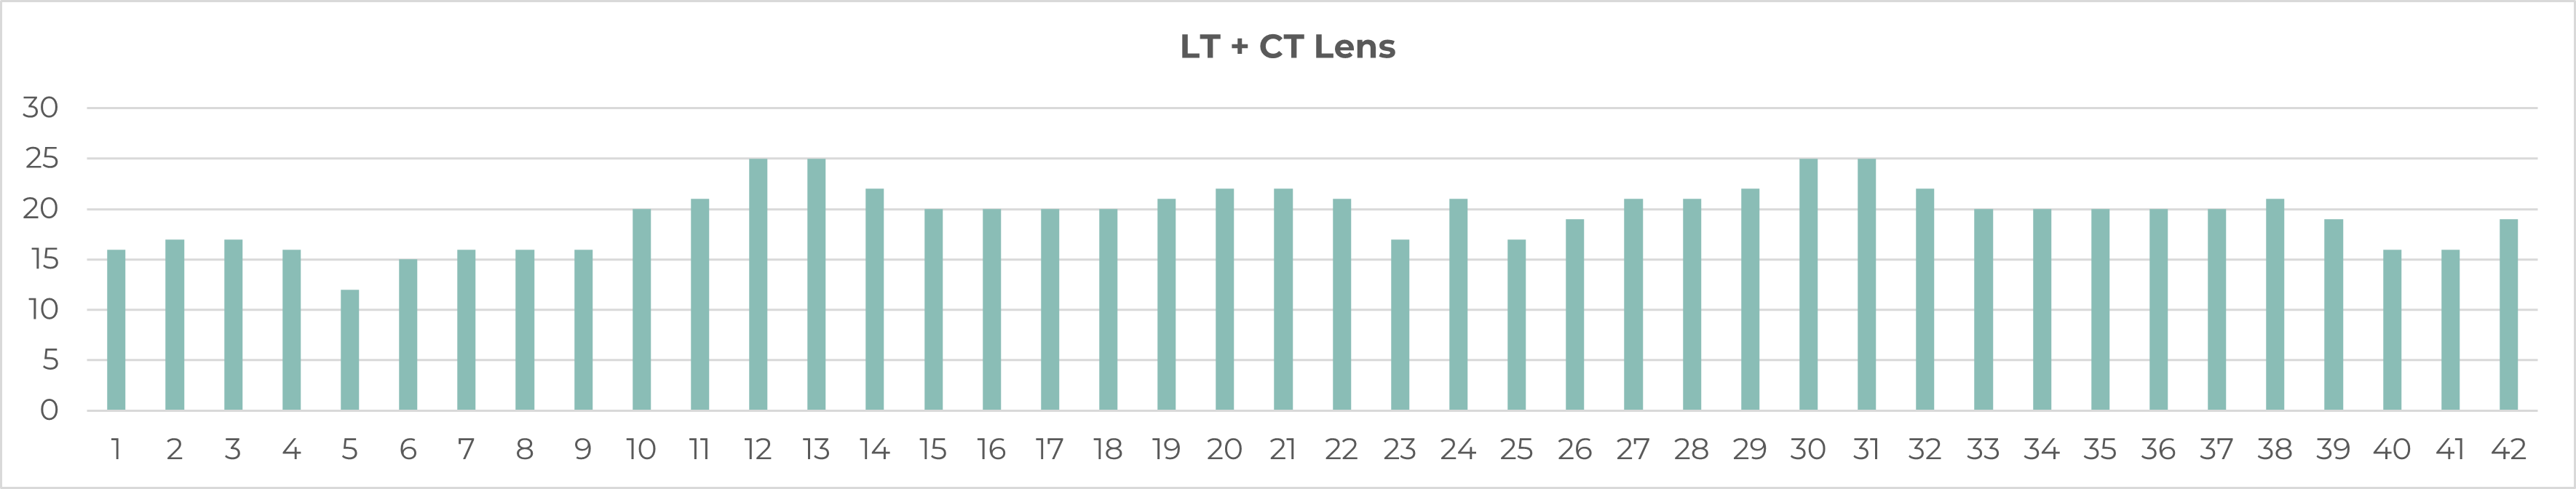
Click to enlarge
Supply Lead Time, Supply Cycle Time and Customer Order Time
Kate then proceeded to ask Jane if some customers ordered the product with a due date further out in the future. Jane confirmed that at least some demand had an order lead time. Kate suggested that in this case, the customer is essentially helping by placing an order in advance. From a safety stock perspective, this meant that one has to worry about a shorter lead time. An extreme case of this would be when the customer order lead time is significantly more than the supply lead time + supply cycle time. This would effectively mean that the business could operate as a make-to-order (MTO) business. Thus, in cases where the customer order lead time was greater than 0, it could be subtracted from the total lead time.
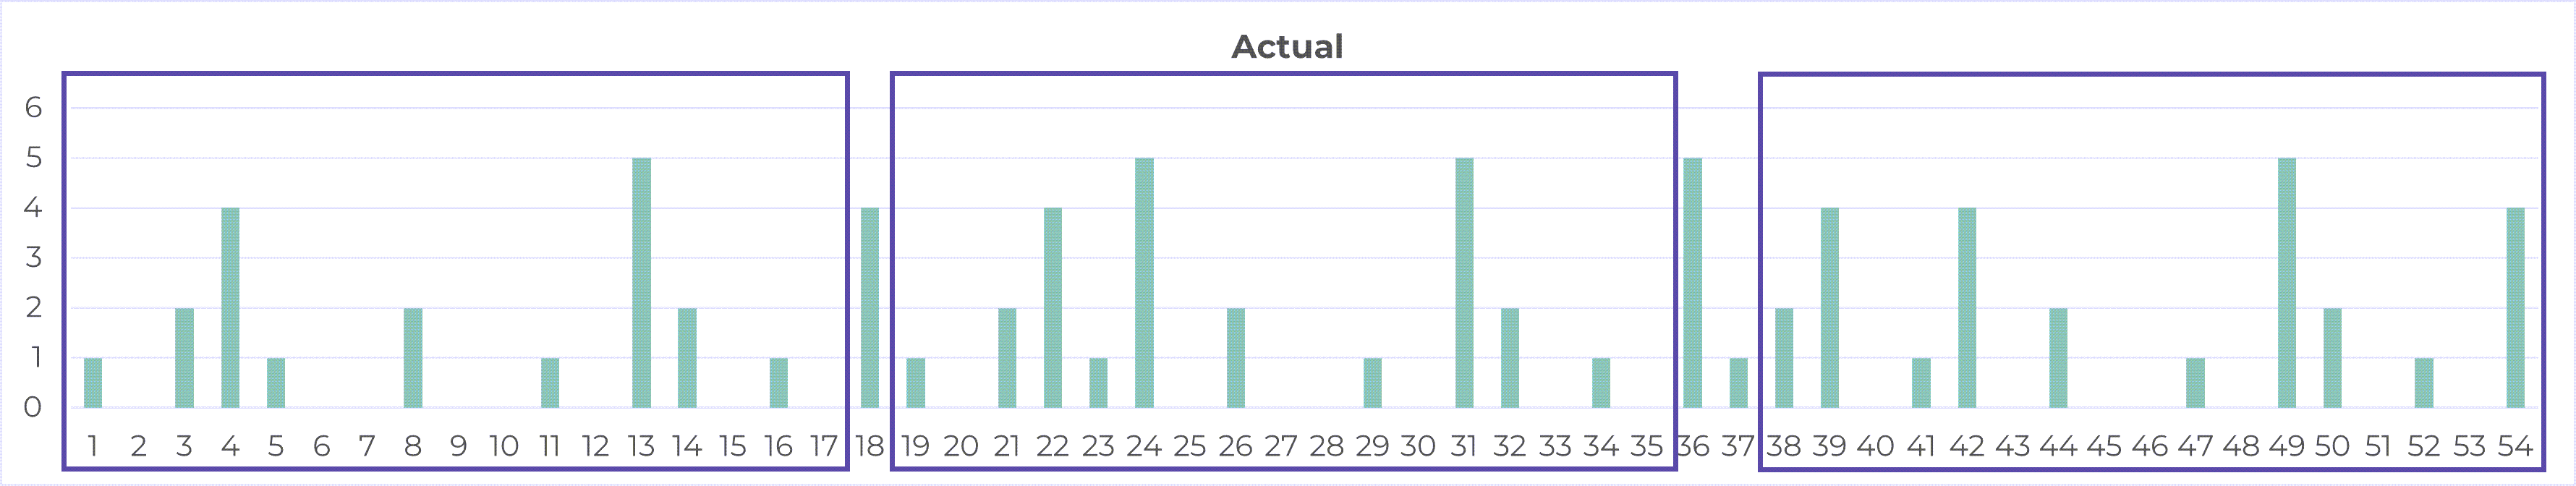
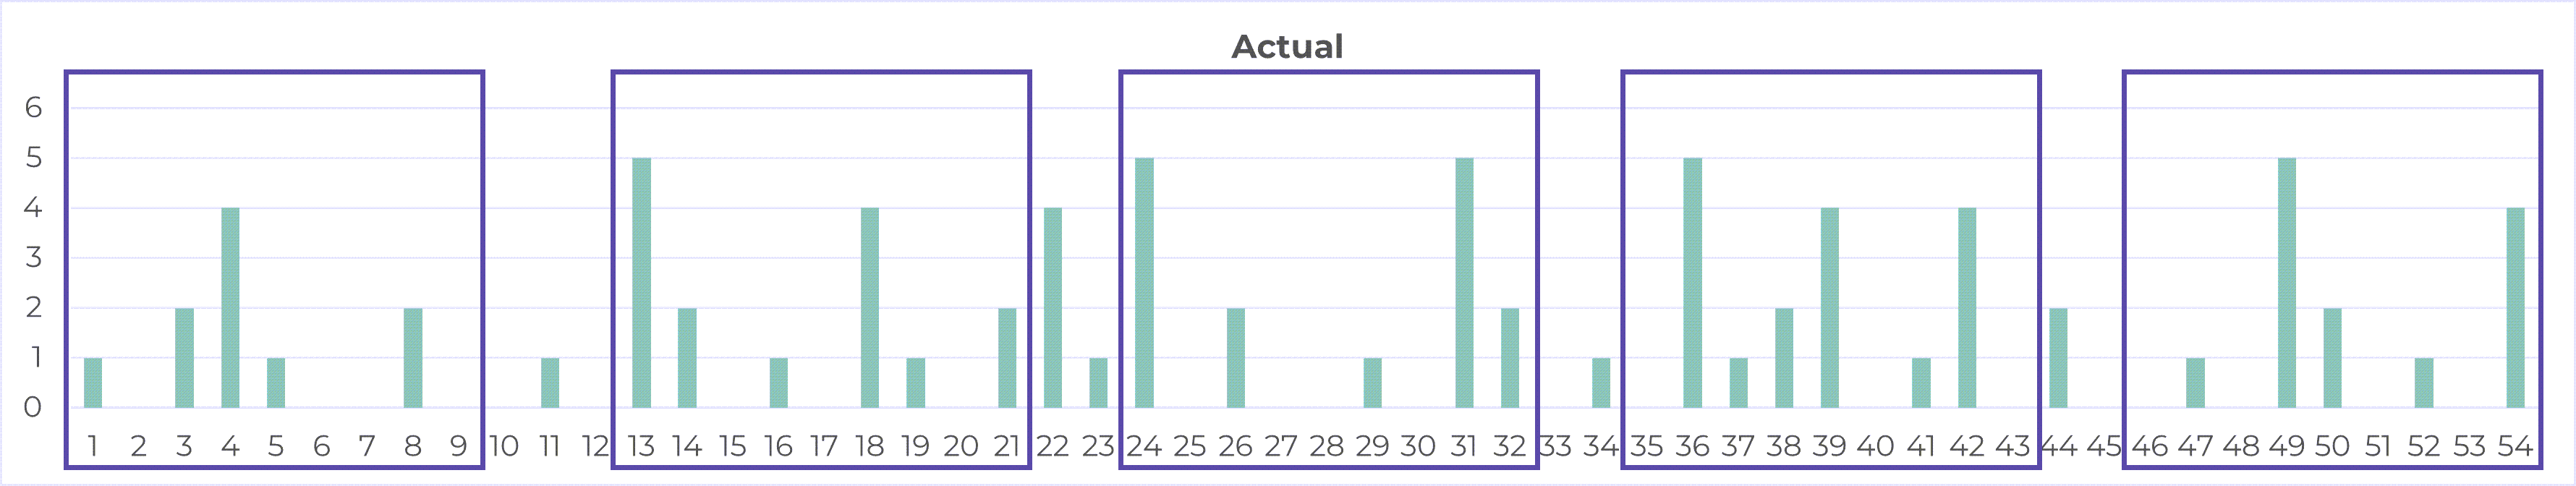
Final lead time to be considered for safety stock = Supply Lead Time + Supply Cycle Time – Customer Order Lead Time. In the example above, if the customer order lead time was 8 days, then the lead time to be considered for the safety stock calculation would be 7 + 10 – 8 = 9 days. Figure 5 shows what this would look like.
Figure 5
Click to enlarge
Grouping the data this way resulted in an average of 13.11 and a standard deviation of 3.13. (See Figure 6.)
Figure 6
Click to enlarge
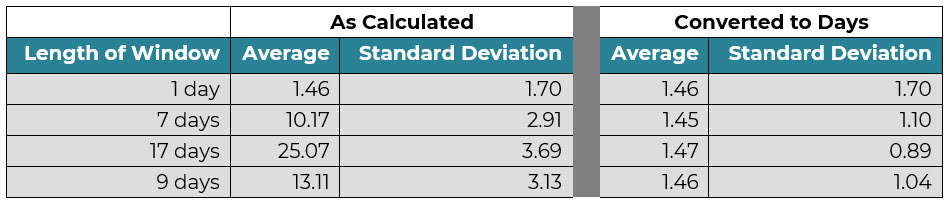
The following table summarizes the averages and standard deviations as calculated by Jane using the three different lead times.
Note to the reader: The average is converted to days by dividing by the number of days in the window. The standard deviation is converted to days by dividing by the square root of the number of days in the window.
Click to enlarge
Kate highlighted to Jane that, as expected, the daily averages from all 4 windows are almost the same. However, the standard deviation at the daily level does show variation. It is the smallest when the window is the widest (17 days) and the largest when the window was the smallest (1 day). This is expected because the noise in the data gets smoothed out as we look at it through a wider window.
At this point, Kate suggested that Jane was ready for the first safety stock calculations using this idea of the variability of the demand over the lead time. We will discuss this in the next blog. Stay tuned.

Read the next blog in the series here.