Missed the beginning of the series? Catch up on part 1, part 2, part 3 and part 4.
In this series of blog posts, we have been talking about Jane who is in the role of inventory planner at her company. Kate, who is a consultant, has been helping Jane with the concept of safety stock and its various implications.
Jane asked Kate, “Can you help me make sense of the service level? Management often asks me if we can support a particular service level or not.”
Kate said to Jane, “All right. Do you have access to the raw order data for any product?”
Jane dutifully pulled up an Excel sheet with order line data extracted from the ERP system and filtered it to a particular product. Kate pointed out that the data was very noisy. She then asked Jane to aggregate the order data in 7-day chunks to reflect the lead time. She called this grouped demand ‘Demand During Lead Time’ or DDLT. They then established the minimum (1) and maximum (332) DDLT. Based on this, Kate suggested grouping the data in ranges of 5. The table below summarizes their findings.
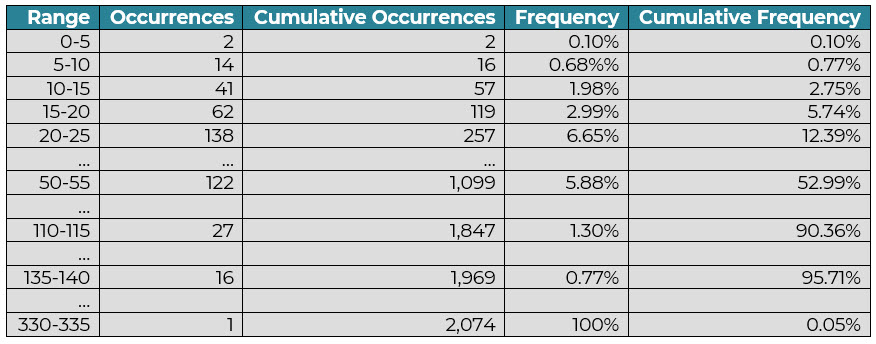
Click to enlarge
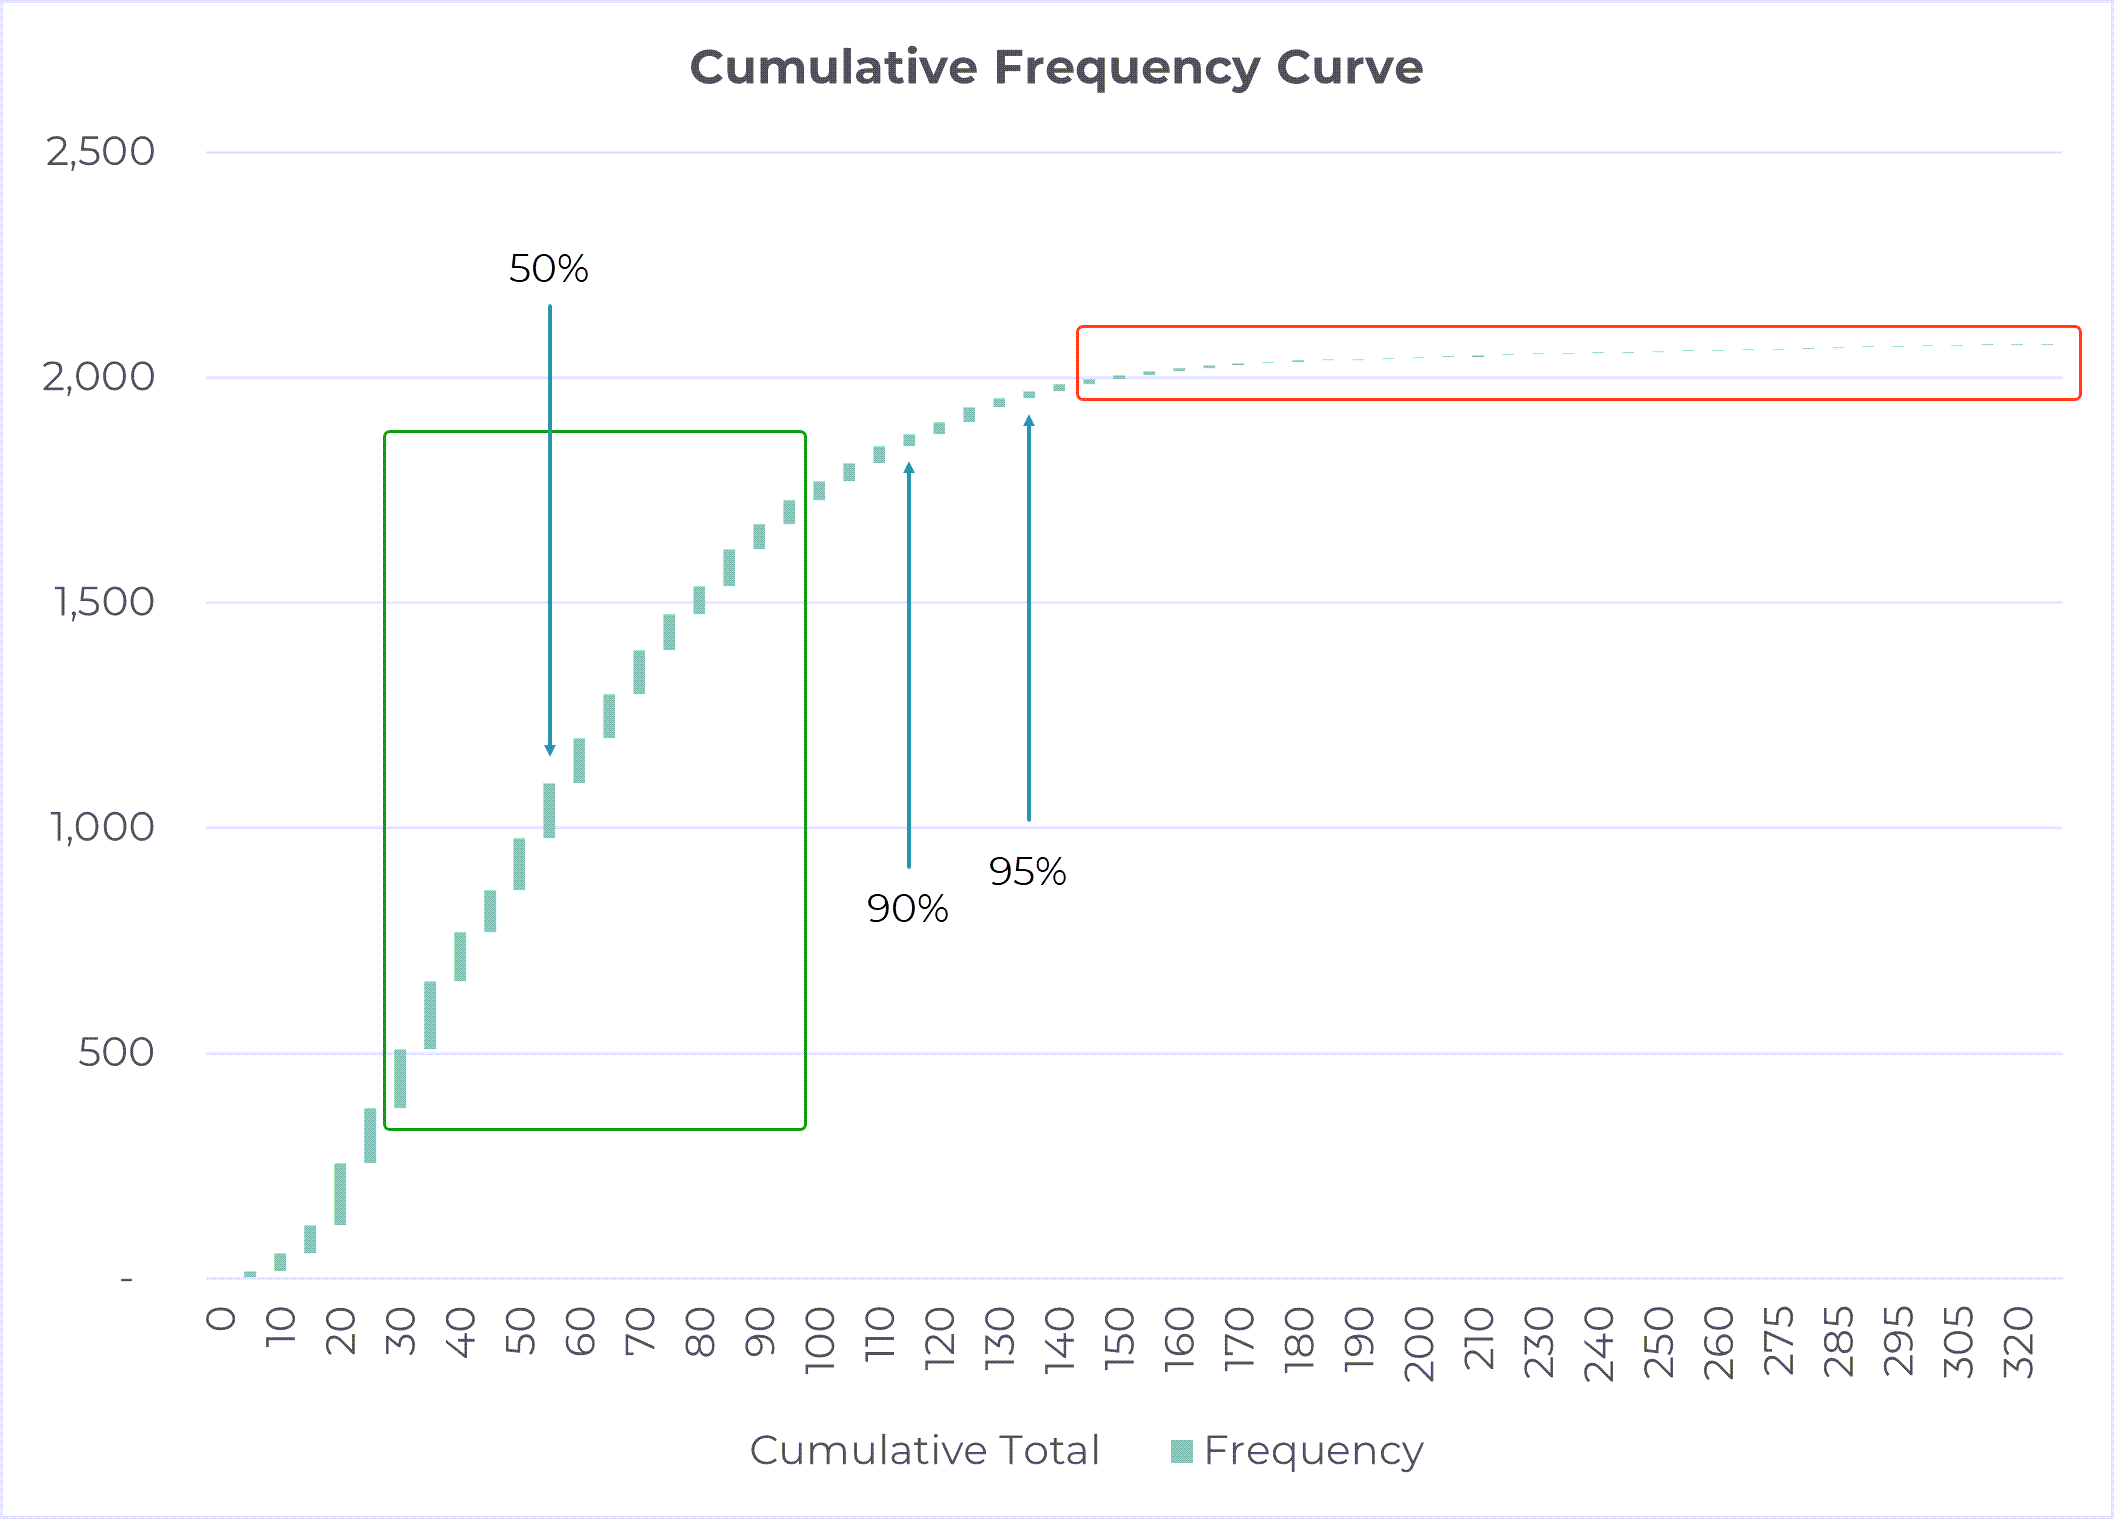
They graphed this data in Excel. Kate called this the cumulative frequency curve. She then drew a green box in the middle of the graph where the columns were the tallest. Kate said, “In many, if not most, 7-day windows, our expectation would be that the demand would be inside that green box. In this data, DDLT was less than 50 47% of the time. And 52% of the time, DDLT was less than 55. So one could take 55 as the approximate mid-point; as in, in half the 7-day periods considered, demand would be less than 55. And the other 50% of the time, it would be more than 55.”
Click to Enlarge
Kate asked, “What would happen if you started with 55 units of inventory in every lead time window?” After some hesitation from Jane, she answered the question herself. “In almost 50% of 7-day windows, this would lead to a stock out as the demand would be more than 55 roughly 50% of the time. How would your management react to these many stock outs?”
Jane answered, “Management would not be happy if there was a stock out half the time. In fact, they would potentially want to meet all the demand to achieve 100% service and therefore always keep 335 units of inventory.”
Kate said, “This idea of chasing 100% service can be very costly as there is no guarantee that the DDLT will never be more than 335. It could be 350, 400, or even higher in a future 7-day window as there is no theoretical limit on the demand. How much inventory would management want to carry in that case?”
Kate continued, “In any case, calculating the safety stock requires us to understand the level of demand associated with a particular service level, say 90% or 95%. Think of a 90% service level like this: In 90% of lead time cycles, I would be able to satisfy all the demand and will not run out of stock. For your data, if I wanted to have a 90% service level, then I would keep 55 units of stock to cover the demand in about 50% of the lead time cycles. The 50% service level requires 0 safety stock. However, if I wanted to achieve a 90% service level, I would carry an additional 60 units of safety stock over and above the 55 units in the previous step. This extra 60 units of stock would cover the demand in an additional 40% of lead time cycles. Doing this, I would achieve a 90% service level as I would not have a stock out in 90% of the lead time cycles. Do you understand?”
Jane replied, “Let me see. Did you arrive at 60 by subtracting 55 from 115? If so, can I achieve a 95% service level by keeping 140-55 = 85 units of inventory as safety stock?”
“You got it,” Kate replied. “Note that you will be holding more than twice the inventory for a 90% service level, and more than 2.5 times the inventory for a 95% service level when compared to the 50% case. That’s a lot of safety stock.” After pausing for effect, Kate continued, “Do you have data for any other products?”
Jane extracted data for another product and plotted it in the same way as the previous product. And then proceeded to calculate the safety stock similar to the previous product.
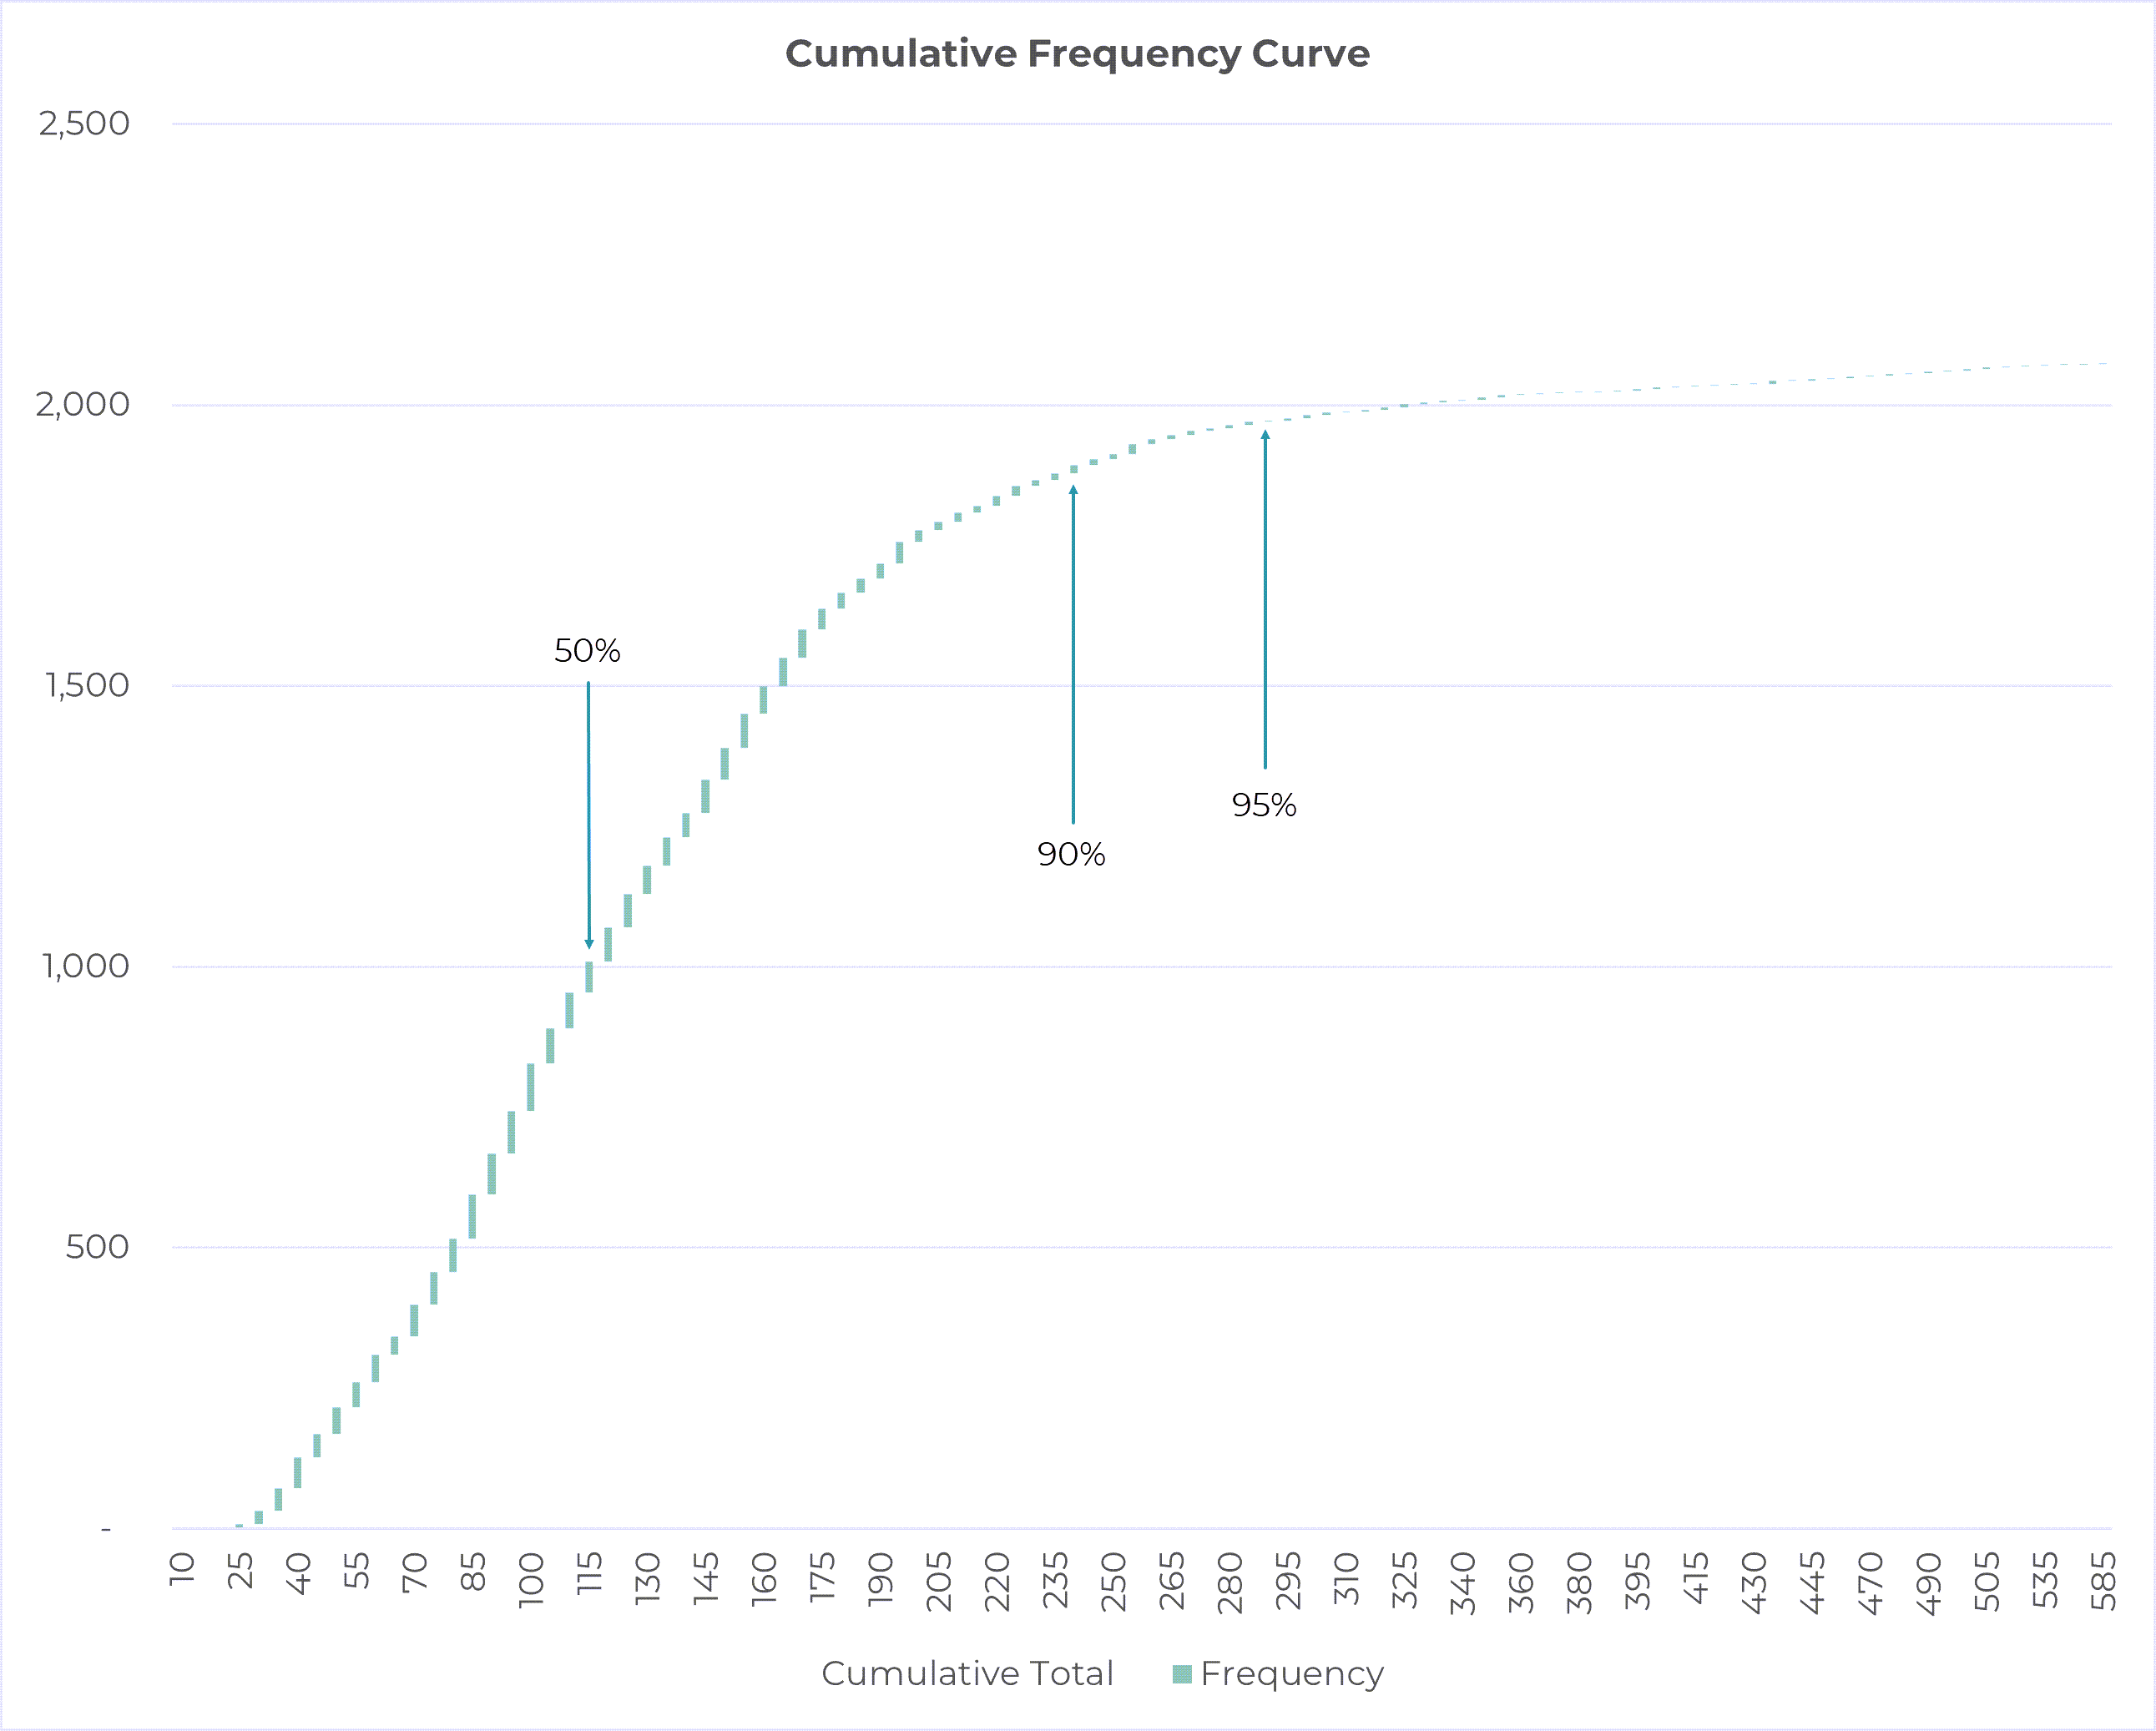
Click to Enlarge
Kate said, “So now you know how you could calculate safety stock for individual products by looking at the underlying data and charts. However, this is not the most convenient. How many product-location combinations do you have in your data?’
“Give or take 10,000,” Jane replied.
Kate said, “Calculating the safety stock this way for 10,000 combinations will be quite a chore. Fortunately, there are faster ways of doing this calculation”.

Read the next blog in the series here.