Missed the first post in this series? Catch up here.
In the last post, we talked about Jane, who is starting her role as an inventory planner. We went through the first attempt at setting up safety stock. In this post, we will continue to explore the next steps in her safety stock journey.
Reviewing Safety Stock Approach
Overall, Jane was dissatisfied with the performance of the safety stocks she had set up. She was calculating the safety stocks based on the period coverage method. The overall customer service level was not always the desired 95%. Plus, management had started to complain about too much inventory. Jane decided to review the approach and adjust as needed.
After some research, Jane saw some relationship between product availability and the location of the suppliers. Products whose suppliers were located nearby with short travel times (lead time) seemed to be the ones with too much inventory. Other products with long travel times were the ones that were more likely to run out. This made sense. If the supply lead time was much bigger than the number of days of stock carried as safety stock, the odds of running out became higher. This made her divide the products into two categories:
- Short lead time (<=28 days)
- Long lead time (>28 days)
Further, she observed that some products were more variable in their demand patterns, i.e., the peaks and valleys in the numbers when graphed appeared to be more extreme compared to other products. She researched a way to quantify this variability and found out about normalized standard deviation. This was defined as follows:
- Normalized Standard Deviation (NSD) = Standard Deviation / Mean
- Statisticians call it the coefficient of variation (CV)
Specific to safety stock, she observed that for the same average (mean) demand, products with higher NSD (or CV) had more stockouts. This made her decide that if two products had the same mean, then she needed to carry more safety stock for the one with a higher CV. She made these adjustments by way of multipliers to the original calculations of safety stock, which was equal to 28 days of demand.
Summary
She summarized her observations and decisions in the following chart and used them to drive execution.
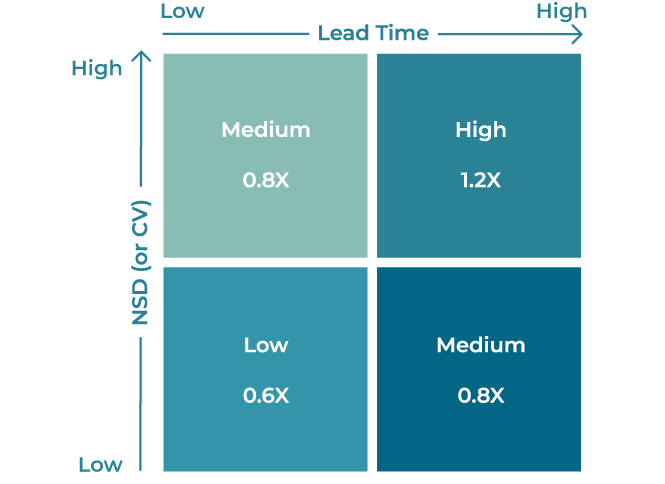
She adjusted the old calculations using the above factors and established new values of the safety stocks for each product. Then she ran the business using these safety stock numbers.
Six months later, the results were still mixed. It was at this time that she realized that she may need some outside help. She asked for funding for an external consultant to provide training and guidance. Management approved this request.
We will look at the outcomes from an external consultant in the next post.

Read the next blog in the series here.