
Modern demand planning teams often use a variety of statistical forecast methods. As advanced as these methods are, they can never predict exactly what is going to happen. Unsurprisingly, there is often a need for the sales teams to provide input into the process. If done right, this can make the forecast much better.
Using Statistical Models to Enhance the Value of Sales Forecasts: Examples
When sales teams provide sales forecasting input they rely on being able to see both the history as well as the computer-generated statistical forecast before making their changes. This visibility allows them to do a quick sanity check of the numbers they have in mind. The input itself can be at a very detailed level or a very high level.
Read More: A 6-Step Guide to Improving Your Statistical Forecast Technique
Keeping track of different sales forecast overrides
For example, a salesperson (say Jane) may have learned that a customer would be taking a shutdown the next month. Due to this information, her forecast would change to zero.
Similarly, under different circumstances (that cannot be known using a statistical forecasting model), Jane might need to increase the forecast by a significant factor. In both these cases, we are talking about making changes at a detailed level (most likely, by the customer, by product). These overrides need to be recorded in the system at the lowest level and are therefore easy to handle. See the example below. The override system keeps track of the forecast change from 115 to 100 for the customer-product combination.
On the other hand, Jane might enter an override that changes an overall number. For example, she might change the overall units from 1 million to 1.2 million. In this case, all underlying combinations will get a disaggregated value. See the example below.
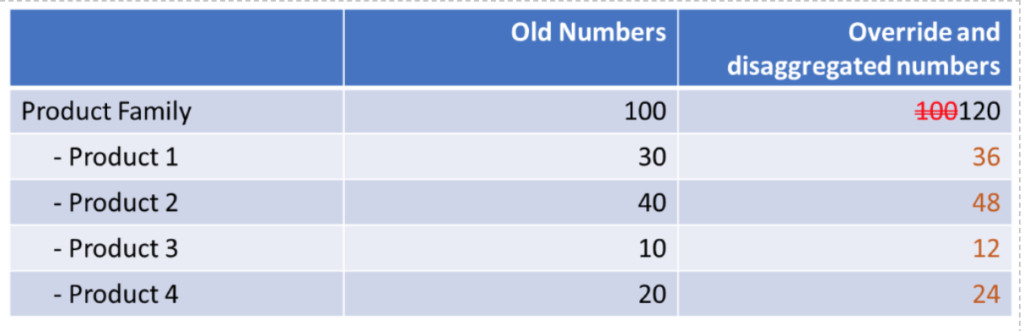
1. The change from 100 to 120 is the override by the user. The change at the lower levels are the disaggregated values.
Read More: Three Steps to a Better Statistical Forecast Setup
What About If You are Providing Sales Forecasts at a Revenue Level?
A corollary of this would be when the sales team provides overrides on a revenue basis (a practice that we generally like to discourage). In this case, the revenue first needs to be converted to several units’ override based on a weighted average price, then disaggregated downwards. (One could also do the disaggregation first and then the conversion).
Sometimes, business users prefer (or are forced) to provide these high-level overrides over a long-time horizon. A common example of this is the annual budget or the financial outlook meeting every quarter.
Here is the message or the purpose for these types of overrides:
At some high level, management has decided that this is how much sales and revenue the business would bring in. So, keep the high-level override and do not change them. However, since supply chain needs a more detailed breakdown, you will need to figure that part out.
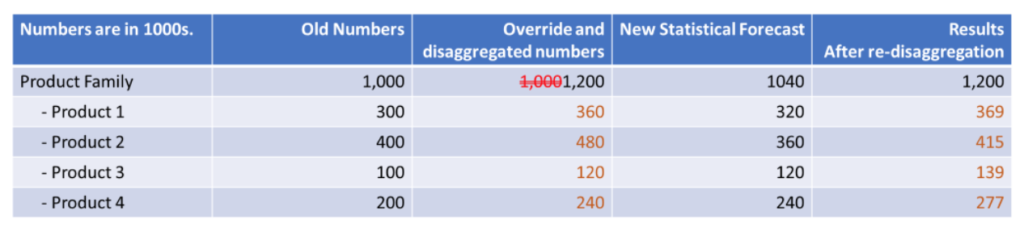
In this case, the easiest thing to do is to keep the high-level forecasts as a separate data field. However, it is helpful for businesses to break this down to a detail level and compare it with the bottom-up forecast. With modern software, it is very easy to disaggregate the numbers down to the detail level. Here are the steps involved.
- Keep these numbers at the high (entered) level in a side table or a data field.
- As you are saving, run the disaggregation routine in your software to break the numbers down to the detailed level. Use statistical forecast numbers as the basis for forecasting.
- Every cycle, as new statistical forecast numbers are generated, reprocess these high-level forecasts in a batch job to disaggregate using the new statistical forecast numbers.
Here is an example:
Read More: What is Statistical Forecasting? A snowfall-based explanation
This approach will make for the best of both worlds: Matching high-level numbers to align with management goals and (simultaneously) appropriately disaggregated detailed numbers to satisfy the needs of the supply chain. The benefit of step 3 as opposed to stopping at step 2 is that one is continually taking advantage of the updated statistical forecast to improve the quality of the breakdown. This, in turn, means getting more of the money’s worth that was spent to acquire the forecasting software.
Enjoyed this post? Subscribe or follow Arkieva on Linkedin, Twitter, and Facebook for blog updates