
Statistical forecasts are often used as the baseline forecast for demand planning. Due to this reason, statistical forecast accuracy is critical to improving the entire demand planning process. Use this easy step by step statistical forecasting technique guide to help you get started with improving your forecasts.
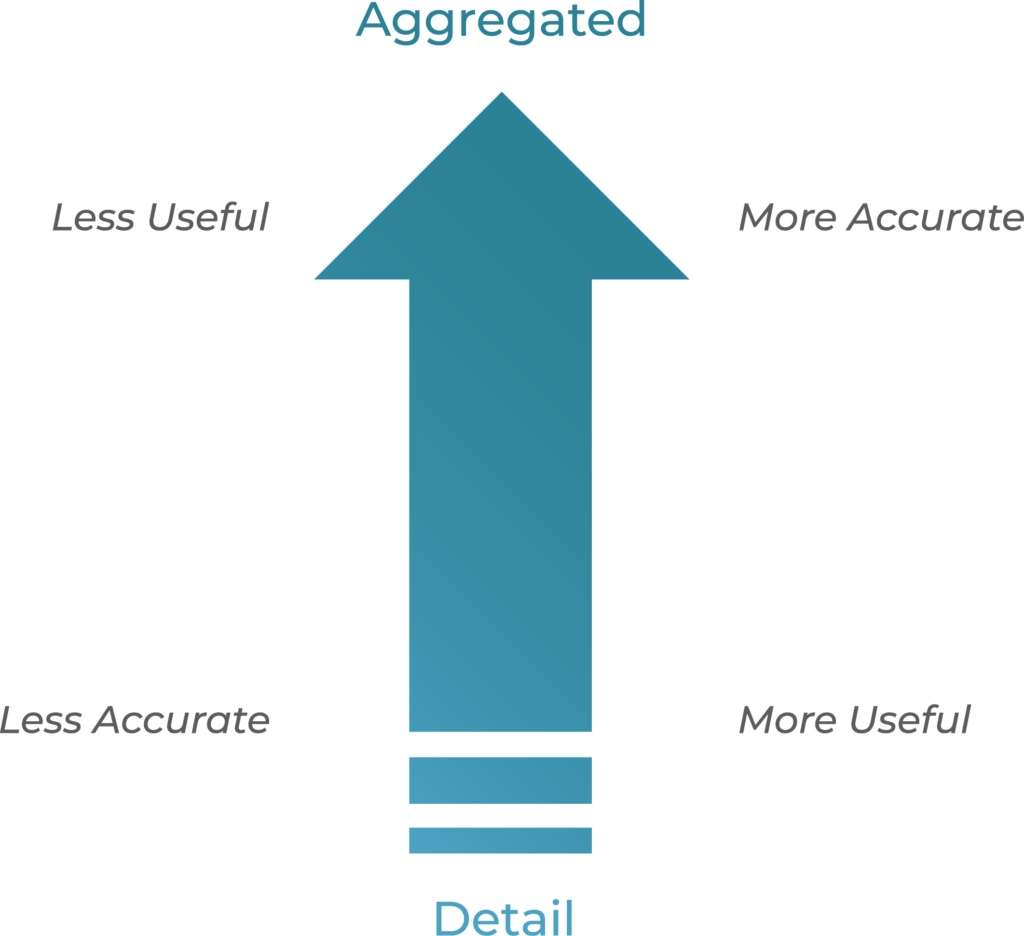
In forecasting, data at aggregate levels statistically provides a more accurate forecast, but it is not the most useful forecast for the supply chain. By contrast, any forecast done at a lower level is not going to be more accurate but can be very useful in driving execution.
As an example:
At the business level, I might be able to forecast an overall 5% growth and be very (95-99%) accurate. However, we cannot make any production/purchase/transfer decisions based on this. At the product-package-location level, I might be a lot less (60-70%) accurate, but that is a forecast I can use to drive execution decisions.
The graphic below summarizes this.
[Read Also: Demand Forecasting: The Art and Science That Keeps You Guessing]
This leads to the question: At what level is the forecast most useful? Here are some ways to think about this:
- If the product you sell is customer specific
- Product-Customer level
- Products which are so bulky, poisonous, or perishable that proximity dictates where they must be made, or when logistics costs are very high
- Product-Location Level
- If the logistics cost is outweighed by manufacturing costs and the focus is on optimizing the use of all production facilities and minimizing manufacturing costs
- Product Level
- If you Assemble to Order or practice Postponement
- Bulk or Stored Product level
You can use the power of disaggregation to improve your forecasts. For example, you might be able to forecast at the product level and capture the overall seasonality, and then disaggregate it to the lower levels by using the forecasts generated at those levels.
A word of caution: Generating forecast at a high level and disaggregating to a lower level is not always going to be better than the forecast directly generated at the lower level. One must always measure the impact and only decide based on what their data tells them.
[Related: The Effect of Currency Demonetization on Statistical Forecasting]
Devising A Statistical Forecasting Scheme: A Six-Step Guide
The following method is strongly recommended when designing a Statistical Forecasting scheme:
Step 1
To start with a clean slate, it is advised that the statistical forecast table is zeroed out in all future periods. Depending on the software package in use, there might be various ways available to do this.
Step 2
Calculate the statistical forecast at the lowest (tuple) level of detail. Use a list of methods as part of the optimal method. This list populates the baseline forecast. The forecast will likely be very bad in a statistical sense. However, it does give us ratios that we can use to disaggregate the data when we generate better statistical forecast at a higher level of aggregation:
- The list of methods used at the lowest level should include a combination of average, sporadic, and may be linear regression and Winters
- At this level, all combinations should be forecasted, regardless of their activity status. (Active, Inactive, Active-New…).
Step 3
Next, calculate the forecast at a sufficiently high (intermediate) level of detail (Product-Parent Customer for example) so that you get a much better forecast. Say each member of this high level is called a ‘combination’. Disaggregate this forecast to the lowest level using the previously calculated ratios. These ratios will not change the ratios for the tuples that fall within a combination; however, they will alter the ratios among tuples that fall across combinations:
- The list of methods used at intermediate level should include a good combination of average, cyclical, sporadic, and trend
- Step 2 can be repeated multiple times to keep improving the ratio. However, the Arkieva recommendation is for up to two intermediate levels if the total number of tuples is less than 20,000 tuples.
- The rule of thumb in selecting the intermediate level is that it should provide at least a reduction of combinations in the 50%-90% range. So, if the number of tuples (lowest level) is 10,000, the number of combinations at the (first) intermediate level should (roughly) be between 5,000 and 1,000. Any more than ~ 5,000 means you are not doing enough aggregation (therefore, not increasing the forecast accuracy enough). Any less than ~1,000 means you are doing too much aggregation (therefore losing information from the data).
- At this level, Inactive combinations should not be included for forecasting.
- At least one of the intermediate levels should be the level at which you will measure forecast accuracy as part of your monthly metrics.
Step 4
At the end of the step above, the new combinations need to be re-processed. Using moving averages based forecast formulas works best in this case.
Step 5
Calculate the statistical forecast at the highest level, where the results are guaranteed to be very good (say Product, or Product Family). This will be the best forecast in a statistical sense. Disaggregate this down to the lowest level using the ratios calculated in the steps above.
- The list of methods used at the high level should include a good combination of average, cyclical, and trend
- The rule of thumb is again 50% – 90% reduction in the number of combinations from the previous level.
- At this level, all tuples (Active, Inactive, Active-New… etc.) should be included to properly capture the seasonal effects.
Step 6
Finally, perform clean-up by zeroing out the forecast for those combinations where you expect no forecast. Any residual effects because of disaggregation will get cleaned up in this way.
- Once a scheme for statistical forecasting has been properly designed and tested, it is best to do the forecasting in batch. To set up batch forecasting, please refer to the section on batch forecasting.
- When setting up forecasting in batch, it is important to remember that if a statistical forecast is run on the exact same data with the same methods, then the results are going to be identical. Sometimes (not always), it is wise to use this fact to design a batch process that runs the statistical forecast every day. At other times, it makes sense to run the statistical forecast batch once a period.
Tying everything together
This method will greatly improve the quality of statistical forecast. However, the statistical forecast should be used to support the decision-making process, never to make the decision. At best, about 80% of products are suited for statistical forecasting. Arkieva has tools such as Quadrant analysis which could be used to identify the combinations that do not make a case for statistical forecasting. Collaborative input from multiple users is the key to improving the final forecast accuracy. Sometimes, it is even better to use a combination to get the best effect.
It is important to remember that the forecast is always wrong. The key to good forecasting lies in reducing the forecast error. A forecast that has been derived from a proper combination of statistical and collaborative techniques provides the best results. It also provides some framework for analyzing why a past forecast was bad, which can further help improve forecasts.
Enjoyed this post? Subscribe or follow Arkieva on Linkedin, Twitter, and Facebook for blog updates.