I was talking to a director of demand planning for a big chemical company at a trade show a few months ago. She shared that her business had implemented a statistical forecasting package from one of the leading vendors during the previous year. She further added that after almost 12 months of going live with the project, any improvements in the statistical forecast accuracy were yet to materialize. Understandably, she was pretty low on the value proposition of statistical forecasting.
After a couple of quick questions about the product that she had purchased, it was obvious to me that the product itself had the right features. She commented that the error seemed to be in the way that the software was implemented, and not in the base capability of the software. For example, the software had:
- All the right forecast methods
- A methodology to pick the best fit method
- An ability to forecast in different time buckets
- An ability to include causal factors in the forecasting
After I returned from the event, my colleague Shankara and I got together to create a methodology that one could use to do a better statistical forecast setup. We assumed that a reasonably good software package was already installed and available. (Having worked in this industry for many years, we already knew that just installing a software does not do much; it must be implemented correctly for the business in question.) Forecasting is empirical and what works for one business does not necessarily work for another. So, we put together a three step program to put a business on the path to do a better statistical forecast setup.
Before one does any of these three steps, they should do the pre-step of taking a current snapshot. This will help measure whether any of the steps are actually adding value and whether or not they should be retained.
So here are the three steps:
1. Simulate
The first step is to simulate the statistical forecasting in many different ways. For example:
- Forecast at the most detail level (bottom up), or forecast at the top level (top down) or start somewhere in the middle (middle out)
- Forecast using causal factors
- Forecast using different methods
- Forecast using different time buckets
- Forecast using more or less historical data
Simulate this differently for different parts of the data. For example:
- Demand in the Asia-Pacific (AP) region might need to be forecasted at a different level and using different methods compared to the demand in North America. One of my clients specifically needed to run a cyclic forecast method based on a three-month cycle for AP.
- Demand for sporadic products might need to be forecasted at a different level using different methods compared to New Products, which might need to differ from stable products.
- Demand for variable combinations might need to be forecasted differently from the not so variable ones.
Once the simulation mechanism is in place, the key would be to capture the forecast at each step and measure the forecast accuracy. This brings us to the next step.
2. Measure
After each simulation, one needs to measure whether the just concluded simulation helps or hurts the forecast. Again, this measurement needs to be done in a proper way. Some questions to consider for this purpose:
- Which of the many available forecast accuracy formulas does the business use?
- At what level should the forecast accuracy be measured?
- At what lag should the forecast accuracy be measured?
Any simulation that is not improving the accuracy as measured in this step could be rejected then and there or marked for further scrutiny.
3. Refine
As one measures the impact of each of the simulation steps, one begins to see some patterns emerge. For example, one might notice that a forecast at the product level followed by a forecast at the product group level can enhance the accuracy of the forecast. Or, one might observe that it is best to zero out certain combination’s forecasts at the end as they are totally unforecastable. Whatever the actual change, refining based on the results from the two steps above makes the forecast much more accurate in the end.
As one refines, it is important to simulate and measure. In that sense, this three step process has a fourth step: Repeat as many times as needed.
Does it work?
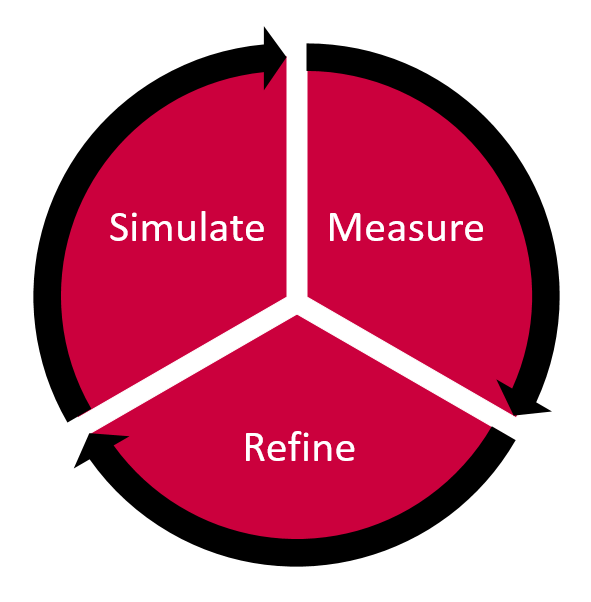
Repeat as Needed!
We have tried this methodology at a few chemical accounts now and this methodology works. Shankara has gone ahead and designed this infographic to explain the steps. The minimum improvement we have seen is 6% at the product level. Improvement of 10% in forecast accuracy is the norm using these three steps.
We recommend using this methodology with your current statistical forecasting package. And revisit from time to time to re-tune. The gains will be more than worth the effort.
If you are only now implementing a statistical forecasting software, consider adding a few days to the project timeline to do the simulation and get it setup correctly from day one.
If you are in the market to buy a software, ask whether such simulations are possible in the software you are about to buy. A good question to ask would be whether the software supports attribute based dynamic hierarchies in statistical forecasting. And also make sure you have a implementation consultant who knows how to do these simulations. If the consultant is from a third party, ask them to prove to you that they can do these simulations.
If such simulations are not possible in your current software package, consider doing them in Excel. You can always contact us if you would like to set this up in Arkieva.
Questions? Comments? Ideas? Please let us know via your comments.
Like this blog? Please share with colleagues and also follow us on LinkedIn or Twitter and we will send you notifications on all future blogs.