As a forecasting practitioner and a demand planning consultant, I have grappled with the following question many times: What is the best way to setup my statistical forecasting hierarchy? Should I forecast top down, bottom up, or middle out?
Before we get to the answers, let me briefly describe the three approaches. To make the explanation more clear, let us consider a hierarchy of product related attributes. The following is the sequence of the levels in an example product hierarchy, from lowest (most detail) to highest (least detail).
- SKU (Base product + package; think half gallon carton of milk)
- Base product (think milk)
- Product Sub-Family (think Liquid Dairy)
- Product Family (think Dairy)
The above four bullet points describe a hierarchy as it exists within the product structure.
NOTE: There are other attributes that might be attached to the product attribute structure. For example, there might be an attribute describing whether the milk is:
- Organic/kosher/regular.
- No/Low/Reduced/Full fat content
- New/Mature/Declining in product life cycle
- Others
These attributes do not fit the idea of the product hierarchy in the bottom/middle/top way of thinking. They are more lateral in nature. I will comment on these in the next post. For this post, let us focus on the question at hand.
In this example:
- The bottom up approach would mean forecasting at the SKU level and aggregating data up.
- The top down approach would mean forecasting at the product family level and disaggregate down.
- The middle out approach would mean forecasting at one of the levels in the middle (say Base Product) and simultaneously disaggregate up and disaggregate down.
So, back to the question. Which of the three approaches is better? Which approach should a business use?
Limiting ourselves to the three options listed, (HINT: There is a better approach; wait for the next blog), there is a glib answer: Do what works in your business. If the theoretically worst approach works in your business, then the theory is not worth much for your business. And because this is empirical science, it is possible that theory might just fail with your data. So, if you have stumbled upon a winning formula, do not abandon it in the name of theory. But if you have not, read along.
It is a statistical fact that at lower levels of the hierarchy, there is more noise in the data because of the usual ups and downs in the business. As a result, the statistical forecast generated is usually a flat line using average or smoothing methods. By contrast, the forecast generated at the higher levels of the hierarchy is usually pretty good because the data is able to support trend analysis such as seasonality etc.
Thinking along a different axis of usability of the forecast, it is also a fact that the lower level forecasts are more easy to execute. It is one thing to know how much demand there will be for a product family, but that still leaves the task of breaking it down to the individual products so plants know what to make. If, on the other hand, the forecast was done at the SKU level, then there is no doubt what to make as long as the forecast is believable. The following image shows this challenge of accuracy versus usefulness of the forecast.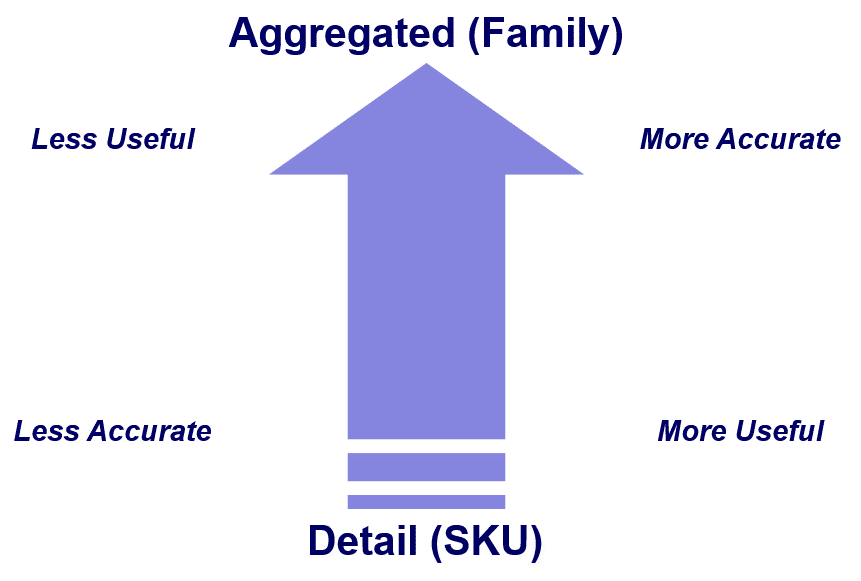
So, how does one resolve this? One approach is the attribute forecasting that I will describe in the next post. But, if your software can only do one of the three techniques, then I suggest that you try to execute the following sequence.
- Create a detail (SKU) level forecast.
- Create a high level (for example, product family) forecast.
- Use the forecast generated in the first step to do the proration to the lower levels.
- Repeat as necessary.
- Evaluate at each step and use what works.
I have used this technique many times over the years and I see that a significant forecast improvement can be achieved using this technique. I think it works because it takes advantage of the good things in the forecast generated at both levels.
What do you think? Have you experimented with this before? Let us know via comments.
Like this blog? Please share with colleagues and also follow us on LinkedIn or Twitter and we will send you notifications on all future blogs.