Summary:
We see graphs of COVID-19 events on a regular basis these days. Two common ones are bar charts for daily new events (COVID-19 cases, hospitalizations, deaths) and the “sweeping curve” to capture a cumulative number of events. Additionally, log transformations are mentioned. The purpose of this blog is to shed a bit of light on these curves and the role of the log transformation. A previous blog covered the basics of rapid growth and the impact of social distancing. This blog is part of Arkieva’s COVID commitment.
Introduction:
When one reads or hears a presentation about COVID-19, there are graphs all over. Two common ones are the number of new events COVID per day (COVID-19 positives and hospitalizations for example) and the cumulative number of events since some starting point.
Example
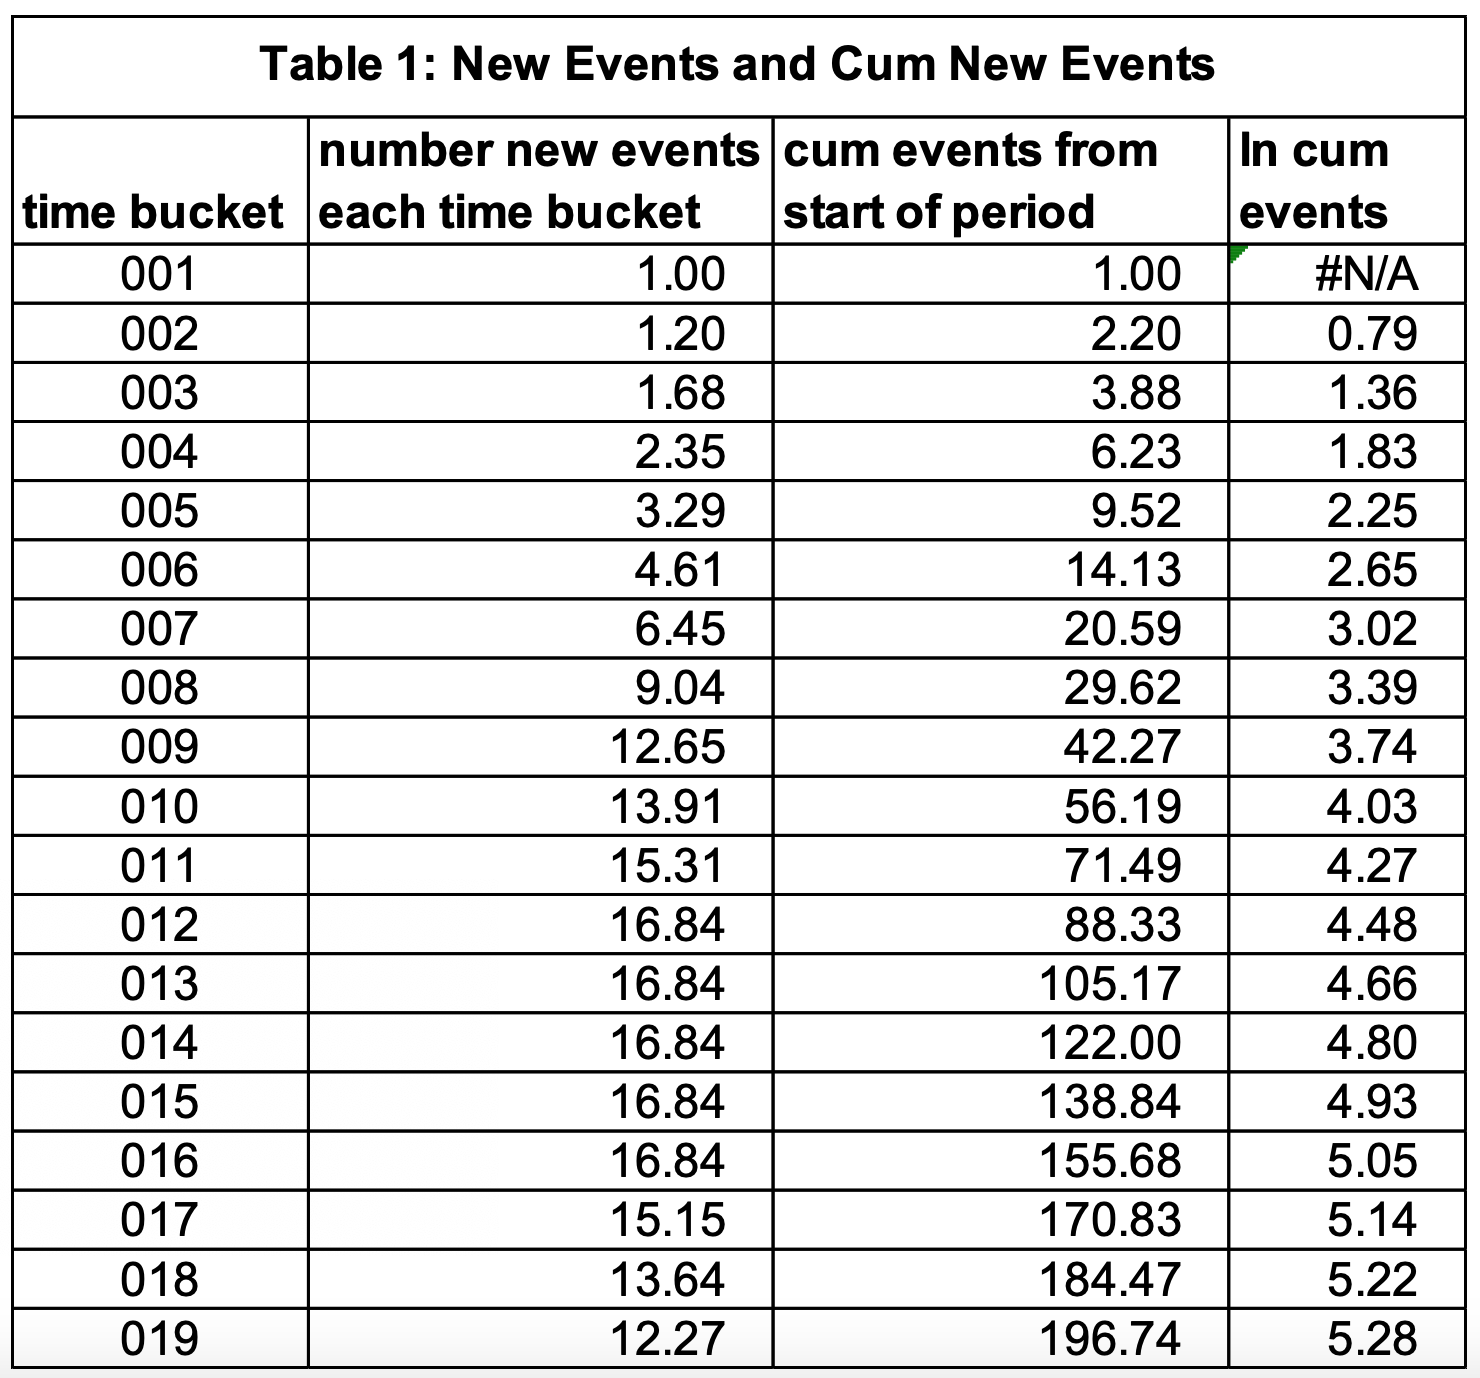
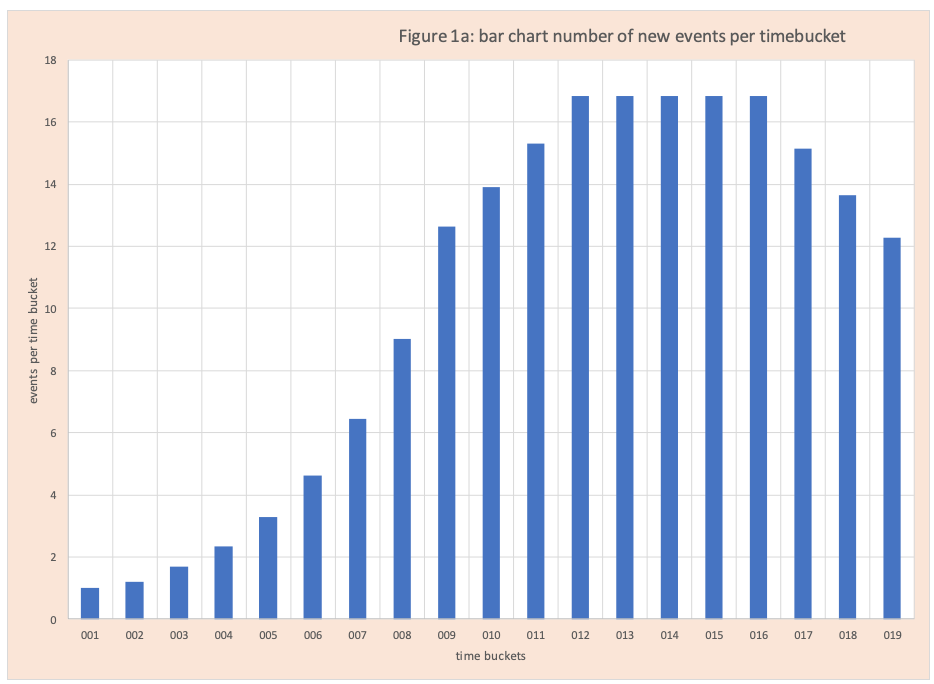
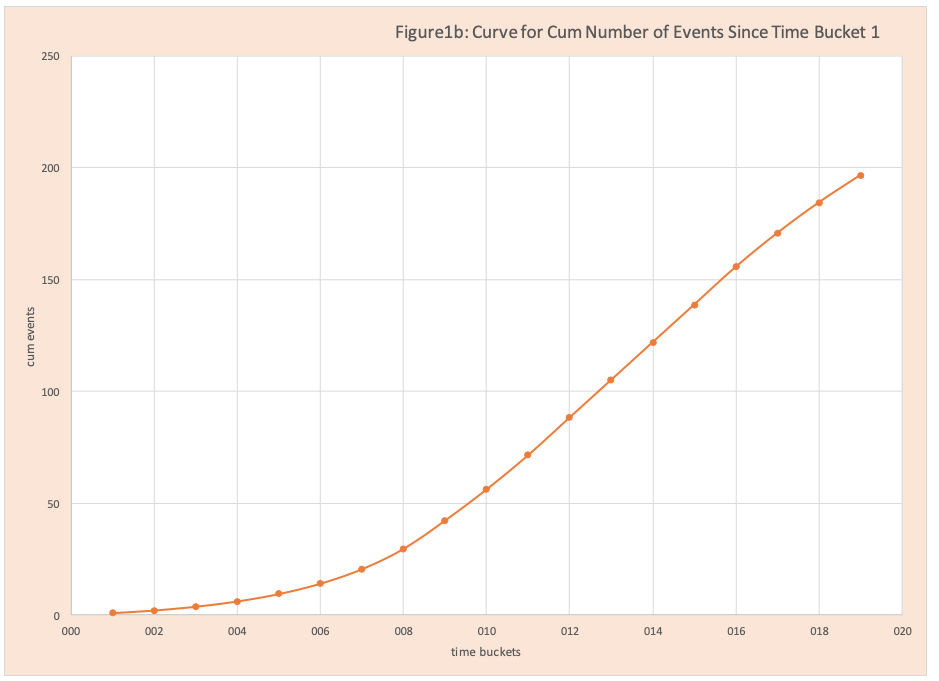
Table 1 has the source data for Figure 1a and Figure 1b. Figure 1a is a bar chart of the daily number of new events (COVID-19 cases, hospitalizations, and deaths). On Day 4, the number of new events is 2.35. The cumulative number of events on day 4 is 6.23. The cumulative values are shown in Figure 1b which is a scatter plot and we see a sharp upward rate of increase for time buckets 1-8. Then the rate of increase levels off and slowly drops. Although the rate goes down, the number of new cases remains large and the number of cumulative cases continues to grow.
Learn More: Taking the Mystery Out of the Rapid Growth of COVID-19 and the Purpose of Social Distancing
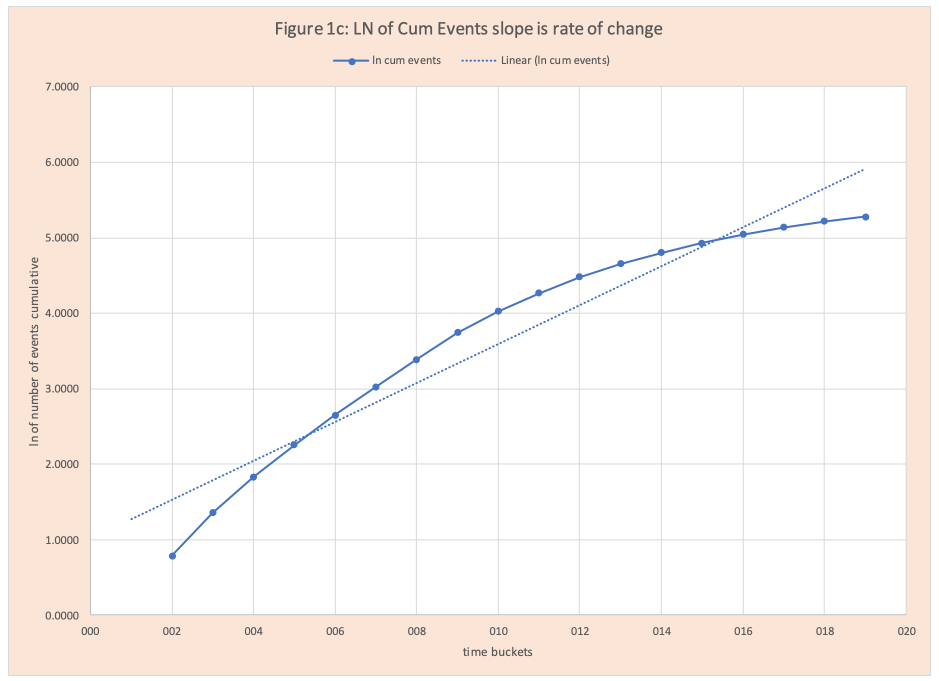
Judging the rate of increase from the graphs in Figure 1a and 1b is difficult. Here using the log transformation (=ln() in Excel) of the data is very helpful. Figure 1c has this graph. The slope of this line is the rate of change of events. As this line flattens (slope closer to zero), the rate of change declines. If the slope is zero, there are no new events occurring.
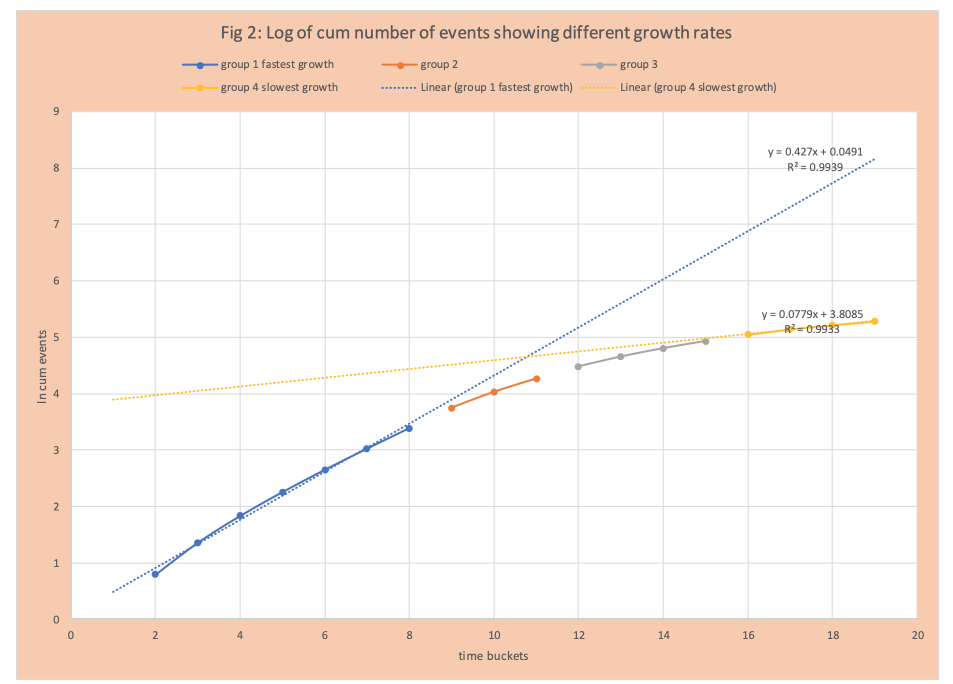
To make the point clearer, we’ll partition the data available into four groups, based on their rate of growth (there are computational methods to do this). For group 1 we calculate the best fit straight line. The same was done for group 4. This information is displayed in Figure 2. This graph makes clear the rate of increase is substantially lower for group 4 (slope about 8%) compared to group 1 (slope about 40%). We can see that the use of logarithms can be a very effective visual.
What is a log (logarithm)?
In algebra, I might have an equation y = 3x + 6. If I told you x was 2, then you would execute the calculation and determine y is 12, when x is 6. If I told you y was 15 and asked you what value of x makes this true. You would do a bit of “equation solving” and get ![]() and then do the calculation to determine x must be 3 for y to be 15.
and then do the calculation to determine x must be 3 for y to be 15.
Now if I had the equation ![]() , told you x was 2, you would calculate y was 9. If I told you y was 27 and asked you what value of x makes this true, you have no algebraic method to find the inverse. The logarithm (officially log base 3) is the method to find the value of x that makes y 27. The equation is
, told you x was 2, you would calculate y was 9. If I told you y was 27 and asked you what value of x makes this true, you have no algebraic method to find the inverse. The logarithm (officially log base 3) is the method to find the value of x that makes y 27. The equation is ![]() . In this case if x is 3, y is 27. The log is the inverse of the power function. In the old days we got the log values from tables in the back of our textbook, later part of scientific programming languages. Today it is part of Excel. The method to get the value is from numerical methods – outside the scope of this blog.
. In this case if x is 3, y is 27. The log is the inverse of the power function. In the old days we got the log values from tables in the back of our textbook, later part of scientific programming languages. Today it is part of Excel. The method to get the value is from numerical methods – outside the scope of this blog.
Some important facts about logarithms are:
- b is greater than 0 and not equal to 1
- y must be a positive number
- x is any real number
- The b value in a natural logarithm is e, which is a mathematical constant. It is an irrational number that is approximately equal to 2.718. It appears in many contexts that involve limits. The natural log is usually referred to by “LN”
- LN (1) is zero
- LN (value less than 1) is negative
- LN (value greater than 1) is positive
Summary
The goal is to shed some basic light on common methods seen today to track COVID-19.
Enjoyed this post? Subscribe or follow Arkieva on Linkedin, Twitter, and Facebook for blog updates.


