
Use this example as a starting point to understand the different optimization methods, and when optimization is helpful in supply or central planning.
Supply or Central Planning is a critical component for managing your supply chain or your demand-supply network that operates in a coordinated fashion with all core components of supply chain management. It serves as the central control point for the flow of material or product within an organization and focuses on how to meet prioritized demand without violating temporal intelligence, asset (work in progress (WIP) and inventory), capacity constraints, and attempting to meet business preferences (aka balance supply and demand).
Deciding on the Supply Planning Method to Use
Central planning essentially creates a “game plan” for the enterprise, which typically has two components:
- A projected supply line linked to demand
- Synchronization of the activities of the firm, typically through either starts and intermediary output targets
A critical question any business faces is “which method” to use for “matching.” There are three Primary Modeling Methods to support these decisions and project their impact. In my upcoming webinar on “When to Optimize and When not to,” I’ll discuss this in more detail.
- Rough Cut Capacity Planning (RCCP) – The planner manually makes production starts, allocation decisions quasi-manually, and uses a reasonably simple structure to project its impact.
- Rule–Based Navigation of the Demand-Supply Network (RBN) – mixes traditional Material Resource Planning (MRP) explosion with mechanisms to maintain feasibility and use rules to generate decisions.
- Optimization Based Methods (OBM) aka “Genie Math” – uses search methods from computational optimization to methodically identify and evaluate alternative feasible solutions until an intelligent solution is found with the ability to determine there may be no “great” solution available.
There is no simple answer as to which method works best and “which is best” will probably change over time. The following example will provide helpful information in deciding which method is best for your situation.
Which demand Goes First?
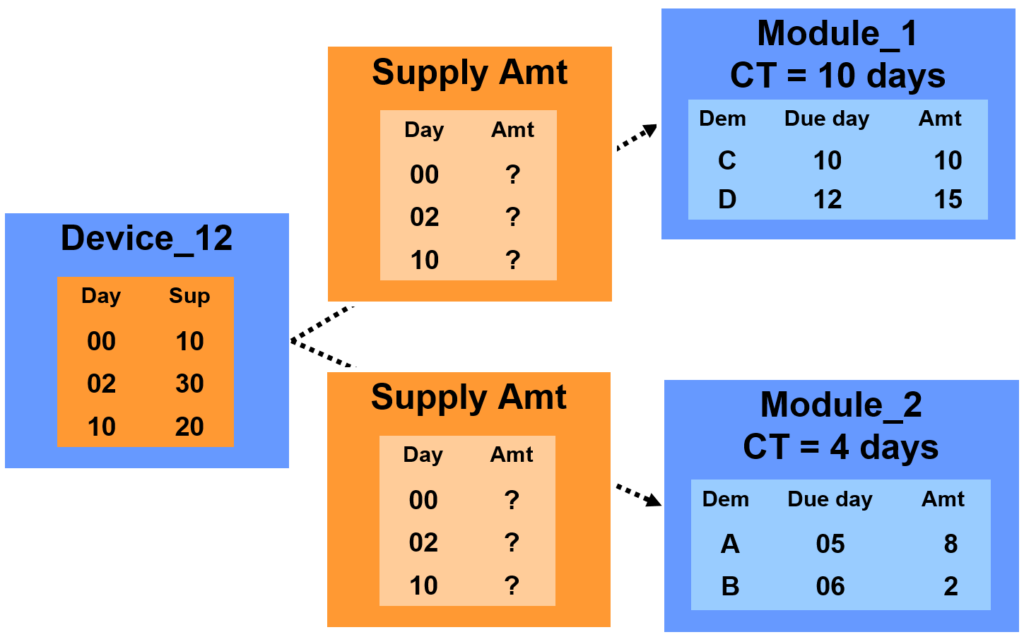
A fundamental decision found in planning and scheduling is which demand “gets to go first”. Or to put it another way, when more than one demand needs an asset (capacity, component part, etc.) and there is not sufficient supply to meet all immediate demand, which demands waits? Figure 01 is an example of allocating the supply of a component part to meet demand. Module_1 and Module_2 are both made from Device_12 with cycle time 10 and 4 days, respectively. The projected available supply for Device_12 is 10 on day 0 (in inventory), 30 on day 2 (projected WIP), and 20 on day 10. The demand for Module_1 is 10 units on day 10 (C) and 15 units on day 12 (D). The demand for Module_2 is 8 units on day 5 (A) and 2 units on day 6 (B). The key decision is how to intelligently allocate supply from Device_12 to meet demand and project the impact of these decisions across time concerning meeting demand on time and inventory days.
We will illustrate an RCCP, RBN, and OBM solution for this situation:
Figure 01 – Device_12 is shared component for Module_1 and Module_2 – How best to assign existing and projected inventory to each module
Solution (S1) is an example of RCCP and is summarized in Table 1.
- Allocate 25 of the 30 units of Device_12 available on day 02 to meet demands C and D resulting in each demand being met on day 12(=2+10). Demand C is 2 days late (10-12) and Demand D is met on time (12-12).
- Allocate 10 of the 20 units of Device_12 available on day 10 to meet demands A and B resulting in each demand being met on day 14(=10+4). Demand A is 9 days late (5-14) and Demand B is 8 days late (6-14).
The scorecard (metric) for solution S1 (see Table 4) is
- Demands A, C, and D met late by 2, 9, and 8 respectively
- The 10 units of Device_12 from day 0 (starting inventory) goes unused.
Clearly, not a good (efficient) solution.

What would be a better or more efficient Solution? If we could improve on-time Delivery and Reduce Inventory days.
Solution (S2 – table 2) is an example of RBN and shifts the efficiency curve improving OTD and inventory. Here we need just one rule, in practice, there are many rules.
- Assign the arriving assets or inventory (Device_12) to the demand based on need date; need date is the due date minus the lead time. The earliest assets go to the demand with the earliest need date.
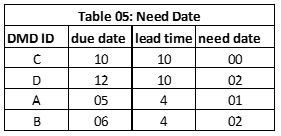
- Immediately allocate 10 of the 10 units of Device_12 on hand (day 0) to meet demand C (10 units of Module_2 due on day 10) which generates 10 units of Module_1 day 10 (=0+10) which is on time to meet demand C (available day 10, needed day 10).
- First on day 2, allocate 8 units of the projected supply of 30 units of Device_12 to demand A (8 units of Module_2 on day 5, need date of 1) which generates 8 units of Module_2 on day 6(=2+4) which is 1 day late to meet demand A (available day 6, needed day 5) – since has as need date of 1.
- On day 2, allocate 15 units of the projected supply of 30 units of Device_12 to demand D (15 units of Module_1 on day 12, need date of 2) which generates 15 units of Module_1 on day 12(=2+10) which is on time to meet demand D (available day 12, needed day 12).
- On day 2, allocate 2 units of the projected supply of 30 units of Device_12 to demand B (2 units of Module_2 on day 6, need date of 2) which generates 2 units of Module_2 on day 6(=2+4) which is on time to meet demand B (available day 6, needed day 6).
The scorecard for this solution (Table 4) is: demand A is 1 day late, demand B, C, and D on time. Initial inventory is immediately consumed. S2 is substantially better than S1 for OTD and demand.
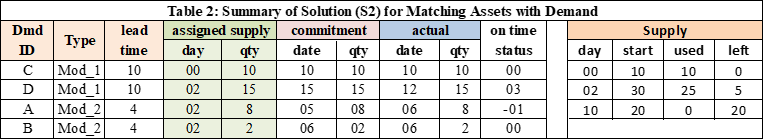
What if Demand A has a much higher priority than the other demands? Do we have a solution that can make its OTD 0? Solution 3 (S3 – table 3), an example of OBM, does this:
- Immediately allocate 8 of the 10 units of Device_12 on hand (day 0) to meet demand A (which is 8 units of Module_2 due on day 5) which generates 8 units of Module_2 on day 4 (=0+4) which is 1 day early to meet demand A (available day 4, needed day 5).
- Immediately allocate the remaining 2 units of Device_12 on hand (day 0) to meet demand B (2 units of Module_2 due on day 6) which generates 2 units of Module_2 on day 4 (=0+4) which is 2 days early to meet demand B (available day 4, needed day 6).
- On day 2, allocate 10 units of the projected supply of 30 units of Device_12 to demand C (10 units of Module_1 due on day 10) which generates 10 units of Module_1 on day 12(=2+10) which is 2 days late to meet demand C (available day 12, needed day 10).
- On day 2, allocate 15 units of the projected supply of 30 units of Device_12 to demand D (15 units of Module_1 due on day 15) which generates 15 units of Module_1 on day 12(=2+10) which is on time to meet demand D (available day 12, needed day 12).
The scorecard (metric) (Table 4) for this solution is demand A early, demand B early, demand C late by 2 days, and demand D on time. The initial inventory (10 units) for device_12 is immediately consumed. Observe it violates our rule and is willing to incur lateness for demand C to meet demand A early. A logical question is “how did the Genie” find this solution.

Which is better? Table 04 provides a comparison
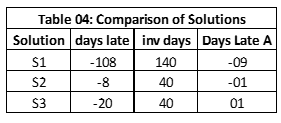
Solution S1 is “worse” (less efficient) than S2 or S3. Deciding between S2 and S3 depends on the relative importance of each demand and the business policy on “sharing the pain” if a demand cannot be met on time. If A is demand class 1 (lower the value, more important the demand – for example a firm order) and demands C & D are demand class 3 (forecast); then S3 is the logical choice when demand classes are pre-emptive. If the demand classes are reversed; S3 is the logical choice. We say S2 and S3 move along the efficiency curve.
How did the Genie find the S3 solution?
How did it know this rule, and what was the rule? In fact, there is no rule – a topic for another time.
[ Read More: Generate, Test, Next: Understanding Computational Principles That Support Important Decision Technologies ]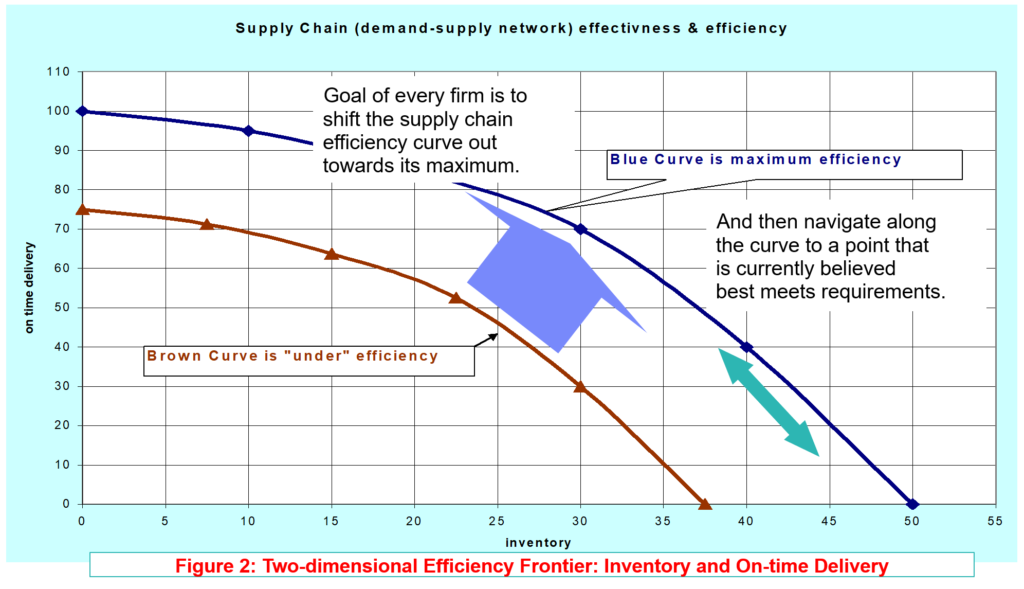
Enjoyed this post? Subscribe or follow Arkieva on Linkedin, Twitter, and Facebook for blog updates.