“Complexity exists, whether you ignore or not – better not to ignore it”
Peter Lyon IBM retired, former director IBM Strategic Systems
In 1995 the IBM Microelectronics Division made a decision to invest in a “smart” central or supply chain planning engine (CPE) to intelligently match assets with demand to improve its performance and responsiveness. CPE was part of a wider effort called OPS (operational framework for supply chain planning) which covered the three pillars of success: data, process, and models.
Twenty years later, the success of this effort has been established. This blog and its companion white paper will review two critical aspects of this decision that has as much relevance today as it did in 1995: (1) The application of the efficiency frontier concept to supply chains and (2) Illustrating the relationship between “supply chain efficiency” and smarter CPE with a simple example that allocates a non-perishable asset (inventory and work in progress) – which Peter used with great success.
Supply Chain Efficiency: In macroeconomics a well-established concept is the “efficiency frontier” or “production possibility frontier”. If an economy is operating below its efficiency frontier, an increase multiple goods and services can occur simultaneously. If an economy is operating at its efficiency frontier, any increase in one product requires reducing the quantity of all other goods produced.
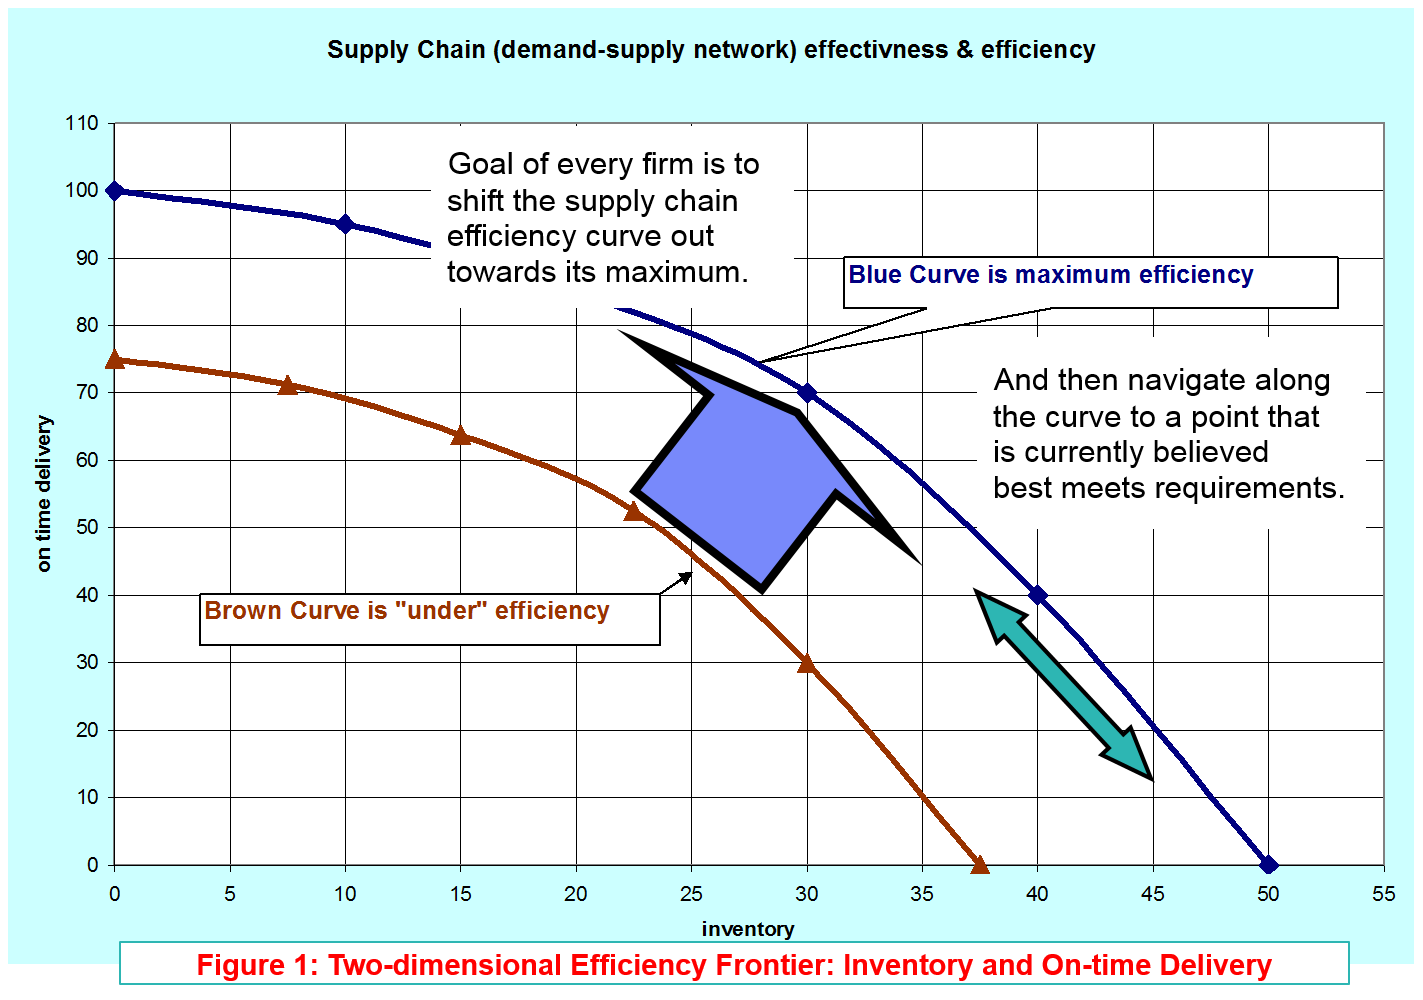
A similar concept applies to supply chains. The efficiency frontier has multiple dimensions (inventory, on-time delivery, customer satisfaction, profit, revenue, growth of market, production smoothing, etc.). For illustrative purposes we have two dimensions (Figure 1): (a) improvements in inventory performance and (b) improvements in on-time delivery. If a supply chain is not operating efficiently, inventory and OTD can be improved simultaneously. If a supply chain is at its efficiency frontier, improving inventory requires reducing OTD. Therefore, the goal of each firm is to first shift the curve outward towards the efficiency frontier; then, the firm will navigate along the curve with great precision to the point that it believes best meets current market requirements.
Alternative Solutions, Efficiency, which is best, smart planning engines? A fundamental decision found in planning and scheduling is which demand “gets to go first”? That is, when more than one demand needs an asset (capacity, component part, etc.) and there is not sufficient supply to meet all immediate demand, which demands waits? A smart planning engine will support “supply chain efficiency” by searching alternative solutions for a “best” allocation of a assets based on the relative importance of the demand, commit dates, capacity, business, rules, etc. The critical terms are “support” and “searching”, it does not replace the planning and management insights, but does enable this expertise to flourish.
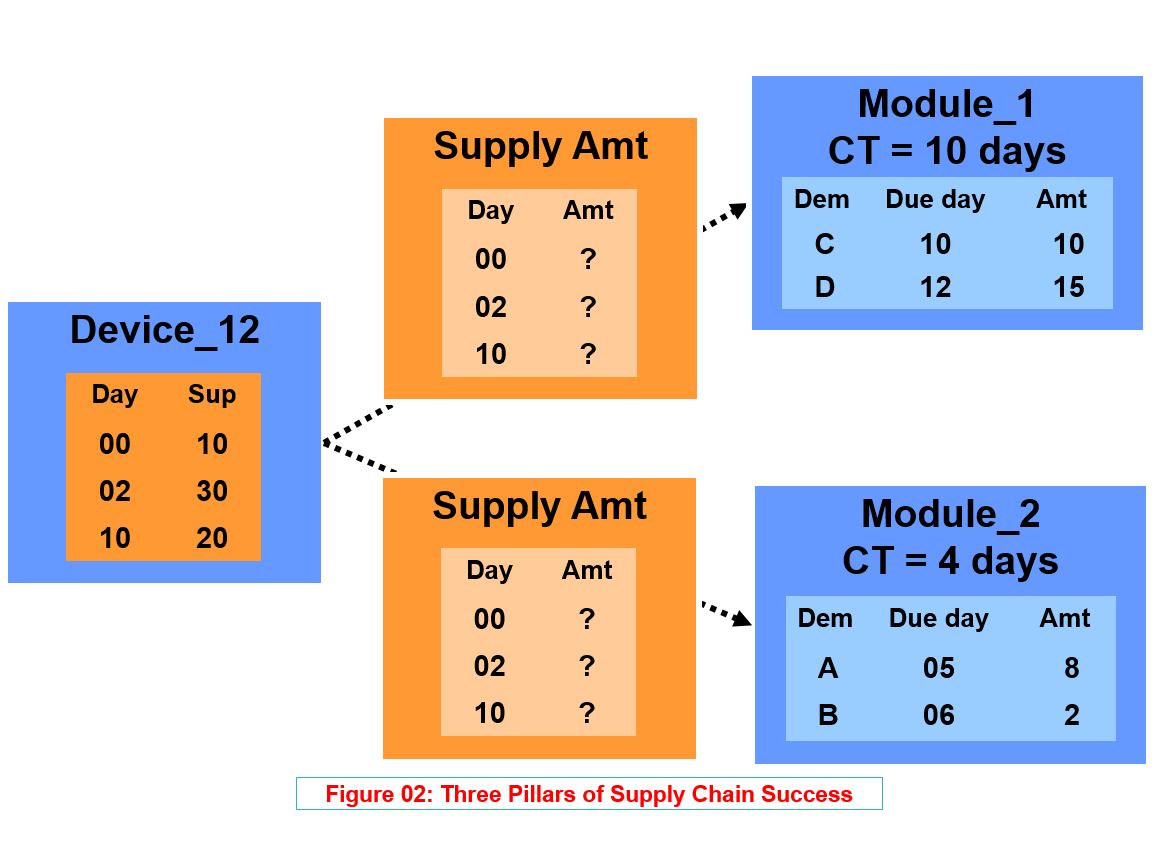
Figure 3 is an example of allocating supply of a component part to meet demand. Module_1 and Module_2 are both made from Device_12 with cycle time 10 and 4 days, respectively. The projected available supply for Device_12 is 10 on day 0 (in inventory), 30 on day 2 (projected WIP), and 20 on day 10. The demand for Module_1 is 10 units on day 10 (C) and 15 units on day 12 (D). The demand for Module_2 is 8 units on day 5 (A) and 2 units on day 6 (B). The key decision is how to best allocate supply from Device_12 to meet demand.
One Solution (S1) is:
- Allocate 25 of the 30 units of Device_12 available on day 02 to meet demands C and D resulting in each demand being met on day 12(=2+10). Demand C is 2 days late (10-12) and Demand D is met on time (12-12).
- Allocate 10 of the 20 units of Device_12 available on day 10 to meet demands A and B resulting in each demand being met on day 14(=10+4). Demand A is 9 days late (5-14) and Demand B is 8 days late (6-14).
I am certain the reader immediately said – what a dumb solution – it fails to the current inventory (10 units available on day 0). This immediately raised two questions
- How do we measure the quality of the solution?
- How do we search for a good solution?
The companion white paper will expands on these two questions by identifying three possible solutions to this challenge of matching assets with demand and the relationship between better organizational performance and smarter planning engines.
Like this blog? Please share with colleagues and also follow us on LinkedIn or Twitter and we will send you notifications on all future blogs.