A colleague and I were talking recently, and the conversation turned to what is the relationship between Mean Absolute Deviation (MAD) and the Standard Deviation (STDEV). They specifically mentioned reading somewhere that STDEV (σ) ≈ 1.25*MAD.
In this post, I will explain to you the math behind that approximation, which by the way, only applies when the error terms (difference between observed and predicted) are normally distributed.
First, let us define these terms mathematically.
For a random variable with probability density function f(x),

All the integrals have limits based on the range of the variable. For a normal distribution, the limits are -∞ and +∞.
Read More: How to Report Forecast Accuracy to Management
The best estimates of these two quantities are:

And

Where n is the number of observations, and Xi are the different observations from 1 to n.
Since we are assuming a normal distribution for this example, it is helpful to remember that the density function of a normally distributed random variable ‘x’ is:

where σ is the standard deviation of the variable x.
Read More: Seasonal Model Forecasting with Seasonal Methods
With those definitions in place, let us look at the following.
If X is a normally distributed random variable with mean μ, let Y = X – μ.
Then, it follows that Y is a normally distributed random variable with mean 0, and the expected value of |Y| is the mean absolute deviation of X (=|X-µ|). The density function of Y can be written as:

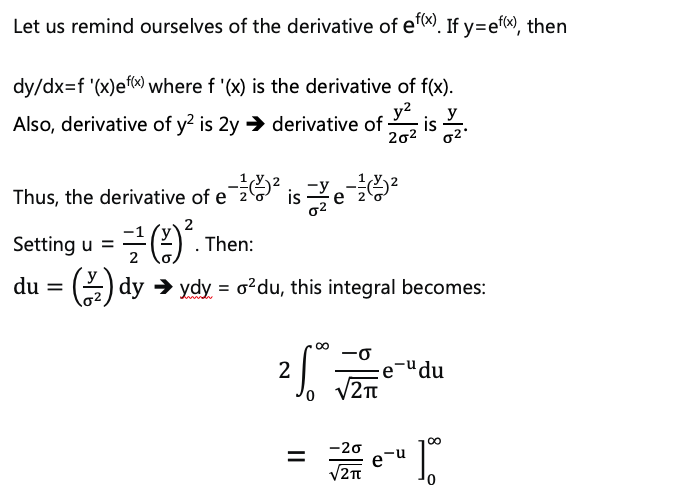
where σ is the standard deviation and the mean is 0. The expected value of |Y| is given by:

These two integrals have the same value as one goes from -infinity (-∞) to 0, and the other goes from 0 to infinity (∞). So, we can just evaluate:


For calculating the limits, remember that e-∞ = 0 and e0 = 1. The above then equals:

Since σ represents STDEV it follows that MAD is standard deviation times ![]() , which is roughly equal to 0.798. By simple math, it then follows that:
, which is roughly equal to 0.798. By simple math, it then follows that:
STDEV ≈ (1/0.798) * MAD
≈ 1.25 * MAD
Enjoyed this post? Subscribe or follow Arkieva on Linkedin, Twitter, and Facebook for blog updates.


