Introduction:
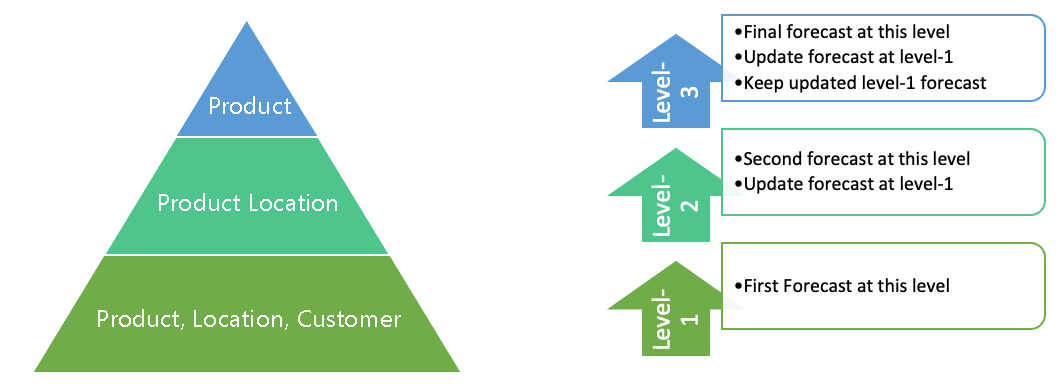
One of the many ways to improve the forecast is to forecast using a pyramid process. A forecast pyramid has a broad base and gets narrower as we make our way to the top. It is made up of layers called levels, with each layer representing a level of detail of the data. The base level of the pyramid represents the most detailed part of the data, with each level of data getting less detail but better in quality as we make our way to the top. For example, a pyramid may have 3 layers (levels) with the base (lower level) of the pyramid having “Product, Location, and Customer,” the second level “Product and City,” and the third level “Product”. The pyramid forecast always starts at the base, then forecasts the subsequent levels moving upwards. And each level the forecast is used to update the base of the pyramid. In other words, the objective of using the pyramid forecast process is to use the less detailed portions of the pyramid to improve the base level forecast of the pyramid.
The level of detail considered appropriate for planning may be different under different conditions. Irrespective of the level of detail, the quality of the forecast is important for future planning. We seek the ideal pyramid that would improve the quality of the forecast.
Quality Definition
To find the ideal pyramid, we need a way to define the quality of the pyramid. This would require a measuring attribute that would be used to measure the quality of the Pyramid. We can use a weighted error measure to represent the quality of the forecast. For a single time series, we can use the weighted MAPE as a measure of the quality definition of the forecast. Let ![]() be the demand at period i, the WMAPE is defined as
be the demand at period i, the WMAPE is defined as ![]() where is the demand forecast of
where is the demand forecast of ![]() .
.
The attribute combination designated for measuring the quality of the pyramid may have more than one-time series and so an extension of the MAPE can be used to measure the quality of the pyramid. If ![]() is demand for product j at period “i” the aggregated WMAPE would be define as
is demand for product j at period “i” the aggregated WMAPE would be define as ![]() . This can further be extended to more than a single attribute. Simply, for any number of attributes, one can summarize the quality definition to the sum of deviations across all the attributes divided by total history across all attribute combinations.
. This can further be extended to more than a single attribute. Simply, for any number of attributes, one can summarize the quality definition to the sum of deviations across all the attributes divided by total history across all attribute combinations.
Data level of aggregation and quality
For illustration, we would use independent attributes Product(P), Location(L) and Customer(C). The product has a dependent attribute “product line (PL)” and location has a dependent attribute “City (Ct)”.
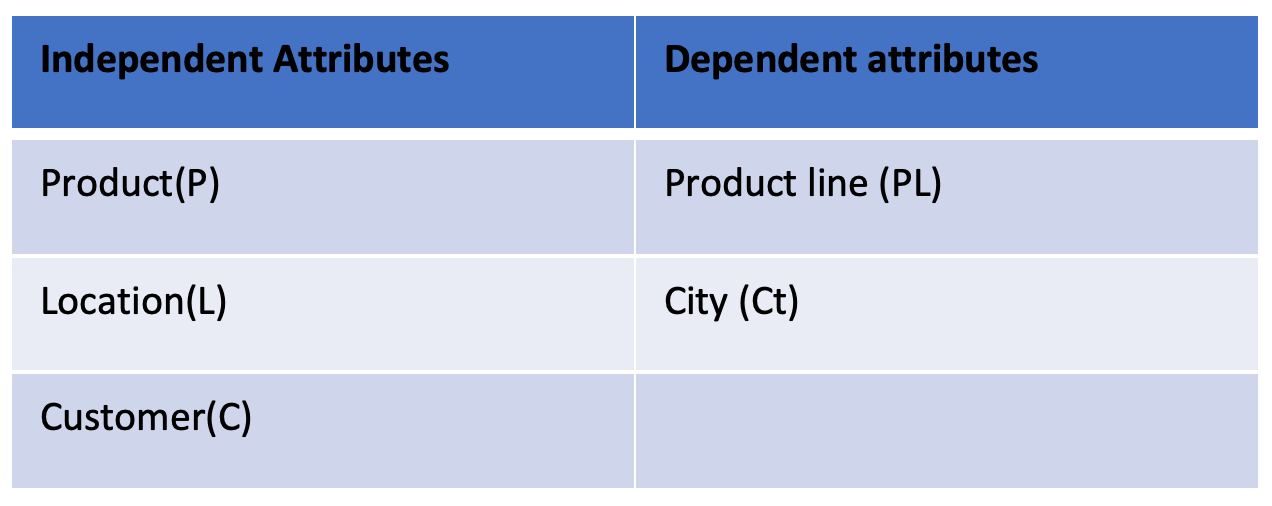
At each level of the pyramid, the list of possible candidates would be the list of attribute combinations.
The possible attribute combinations for any level are shown below. Let’s designate “Product” to be the attribute combination to be used to measure the quality of the pyramid. Since “Product” is the attribute of interest, it or its dependent must be included in any valid attribute combinations. For illustration purposes, we also made up numbers for the aggregated error for each of these combinations.
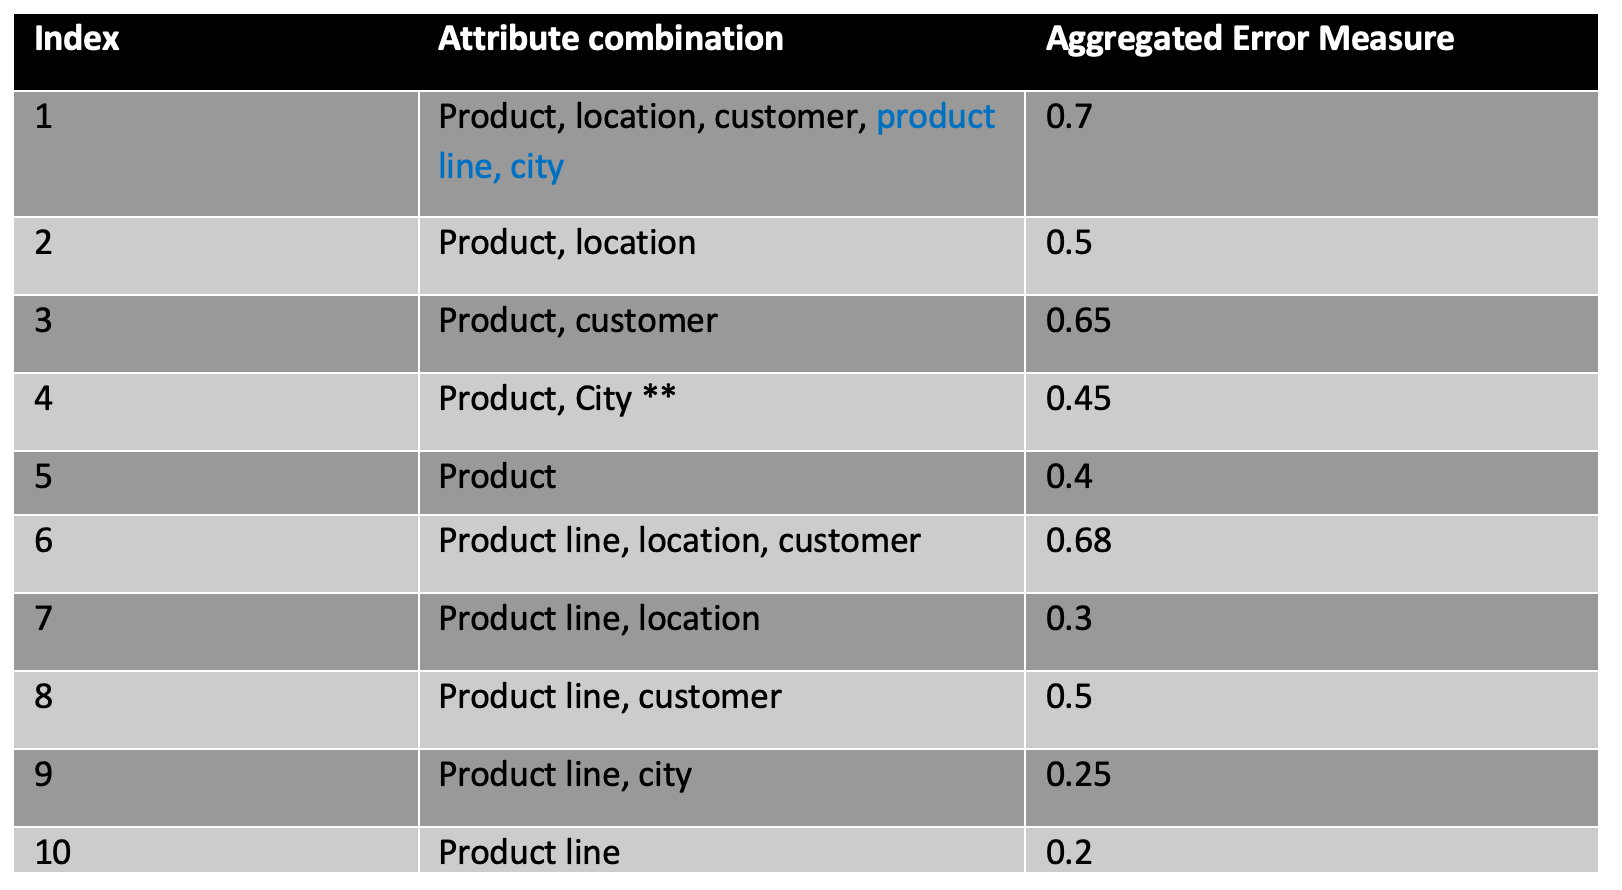
Normally, the more detailed the data is, the less accurate the forecast. Conversely, the less detailed the data is, the more accurate the forecast. A demand planner may prefer a level of detail that perhaps does not meet the desired level of forecast accuracy. For example, Product, Location, and Customer might be deemed appropriate level of detail but it is possible that at the customer level of detail forecast quality may not be good enough.
Aggregation & Disaggregation:
Aggregation is the process where detailed data is summarized into a less detailed form. For example, if we have a product (P) and 3 customers, then the sum of the demands from the 3 customers would yield the total demand for the product.
Disaggregation on the other hand is where less detailed data is distributed to a more detailed set of attributes. Quite often the distribution is made up of proportions to the values at the lower levels. The example below is self-explanatory. The data below assumes a single period.

To aggregate to the level “P-1, L-1” we sum all combinations at the detail level that includes the attribute combination “P-1, L-1”. The aggregated demand must match the higher-level attribute combinations. The aggregated forecast may not match the higher-level attribute combinations.
Aggregation (P-1, L1) =P-1, L-1, C-1: f + P-1, L-1, C-2: f+ P-1, L-1, C-3: f =8+52+60=120

To disaggregate the forecast from “P-1, L-1” to the lower-level forecast, determine ratios for all attribute combination that includes “P-1, L-1” at the lower level.

Then multiply the ratios by the higher-level forecast.

Forecast level Candidates:
At each level, the attribute combination contains several time-series, each time series would be forecasted and the quality measured. Each time-series data is portioned into training and validation data. The training data would be used to train the model and the validation data would be used to measure the quality of the forecast. So, the quality of the forecast and disaggregation would be based on the validation portion of the data.
The quality of the pyramid is determined in 2 steps:
- The updated lowest level forecast values would be aggregated to the measurement attribute level.
- Then calculate the accuracy of the aggregated measure of the measurement attribute.
Constructing a pyramid:
The pyramid is constructed one level at a time. Each level is assigned an attribute combination and a combination can appear only once in a pyramid. Follow the steps below:
The forecast starts at the lower level and moves up towards the top of the pyramid. After each forecast at a level, the detail level is updated. For illustration, let’s assume the minimum number of pyramid levels is 2 and the maximum 4.
At the lowest level, forecast each time series, aggregate to the measurement attribute combination, and measure the quality of the Pyramid; at this point, this is not valid since a valid pyramid requires more than 1 level.
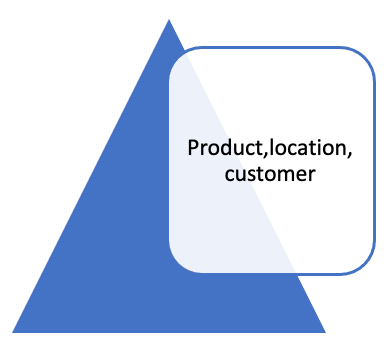
Next is to add a level, the candidate must be selected from the remaining list of possible candidates. So, we select from the 9 remaining candidates. At this level we have 9 possible pyramids each with 2 levels.
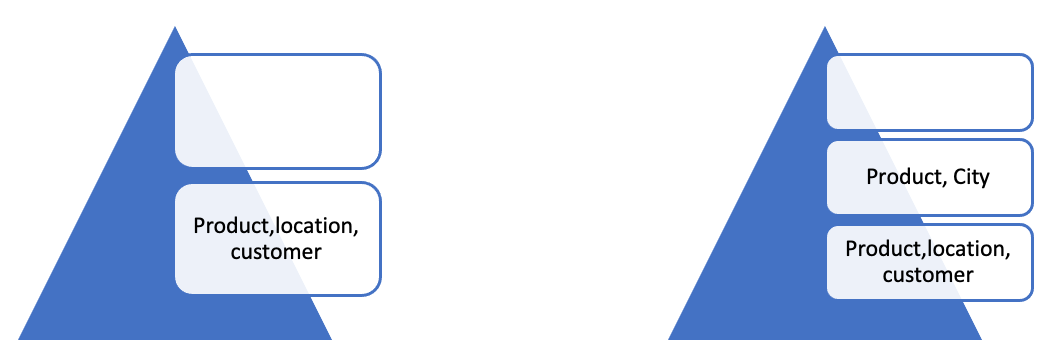
After the second level, there would be 9 possible valid pyramid candidates. For the selected candidate, the second level forecast would disaggregate to update the first level. The first level is then aggregated to the measurement attribute and the quality of the pyramid measured. To add a third level, there are 8 possible candidates for the level to choose from for any of the 9 possible pyramid candidates.
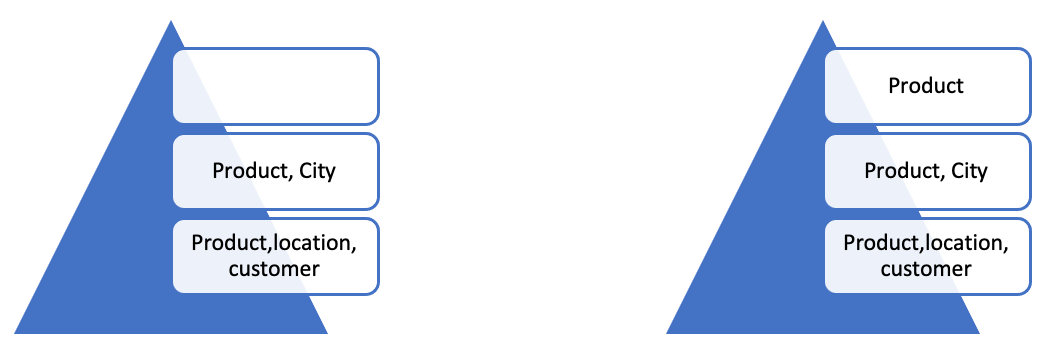
We keep adding levels and measuring the quality until a good pyramid is found.
Search for a good pyramid:
The number of possible pyramids can be quite large. Let n be the total number of attribute combinations; this forms the list of possible candidates for the levels. The first level has only one possible candidate, for the second level there are n-1 possible candidates, after the second level, there are n-1 possible pyramids, at the third level each of the n-1 current pyramid would have n-2 possible candidates for the third level. This is like the number of possible ways of creating a pyramid with r levels with n possible candidates, the number of possible ways is defined as ![]() . Therefore, ignoring the first level (fix), number of possible pyramids with levels ranging from 2 to 4 is
. Therefore, ignoring the first level (fix), number of possible pyramids with levels ranging from 2 to 4 is ![]() =9+9*8+9*8*7=585. If the max level is increased to 5, the total becomes 3600.
=9+9*8+9*8*7=585. If the max level is increased to 5, the total becomes 3600.
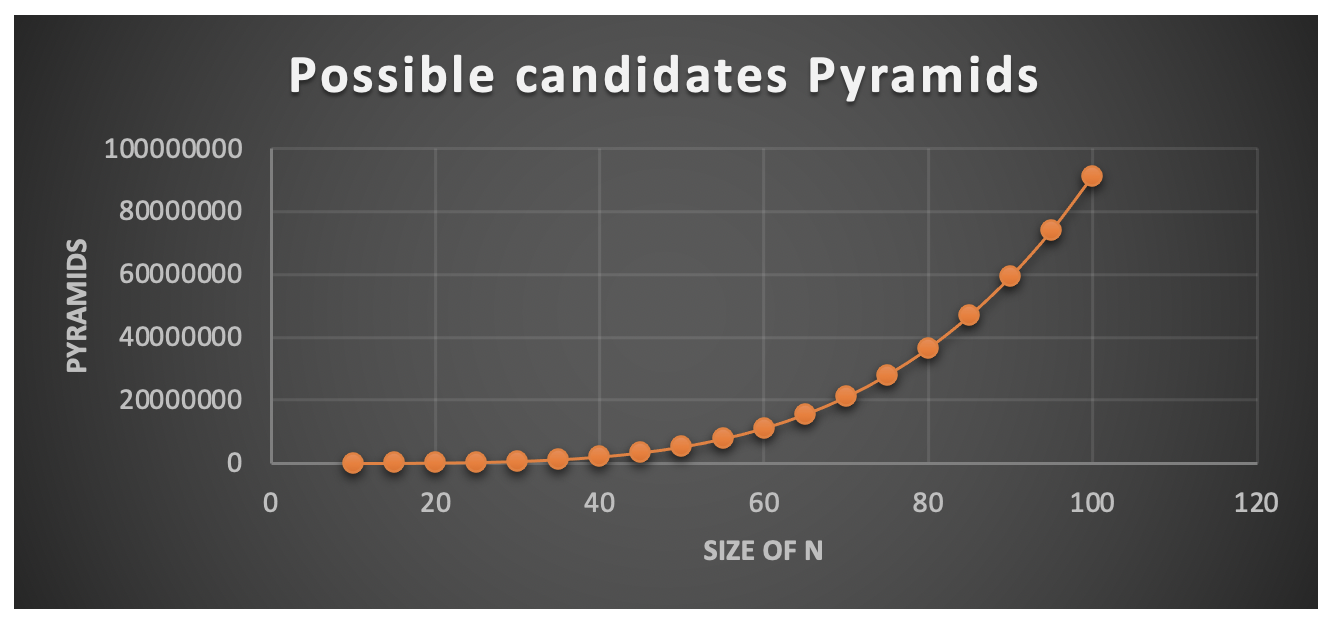
If we decide to process every possible pyramid, then finding the right pyramid can be time consuming especially for large values of n. One approach to avoid processing every possible pyramid is to reduce the number possible candidates at each level. Here are a few rules to reduce the number of possible level and pyramid candidates:
- Remove redundant attributes; in our example above, if we have just a single customer then we can ignore customer attribute and be left with Product and location, and this would reduce the number of possible candidates for a level.
- As we move toward the top of the pyramid, generally we expect the quality of forecast for the selected level candidate to be better than the previous level. In our example, given level one, level 2 can accept all the possible candidates since the remaining attribute candidates for level 2 have better quality than the combination of Product, Location and Customer. If the level 2 were to select the candidate combination of Product and City, then the only possible candidates for level 3 are combinations with aggregated error measure less than 0.45.
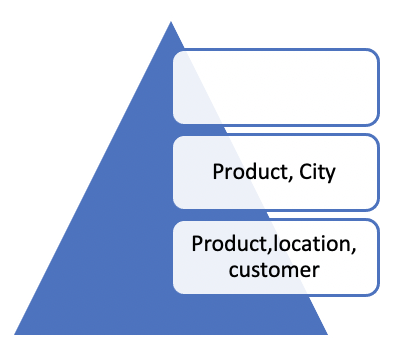
- As we move toward the top of the pyramid, we would expect the level of detail to be less compared to prior level. In our example, level 3 can only have an attribute combination that is less detailed than “Product and City” such as Product.
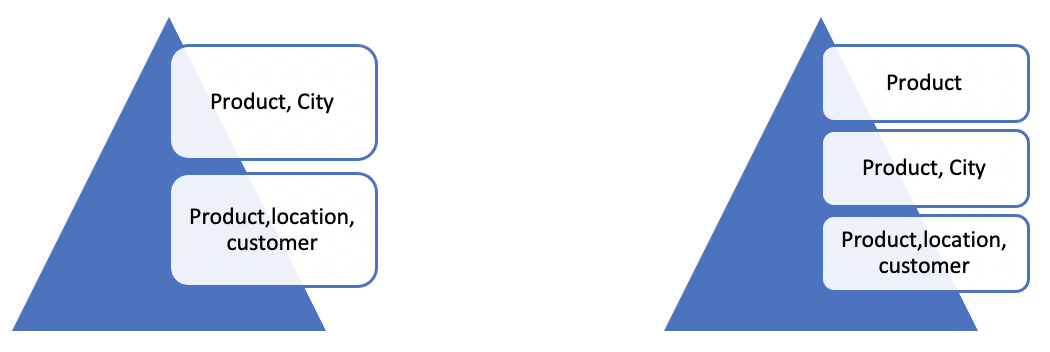
- Once a level is added, the created pyramid (child) must be better than the parent pyramid from which it was built. If not, a level cannot be added to the new pyramid. We only keep the parent pyramid.
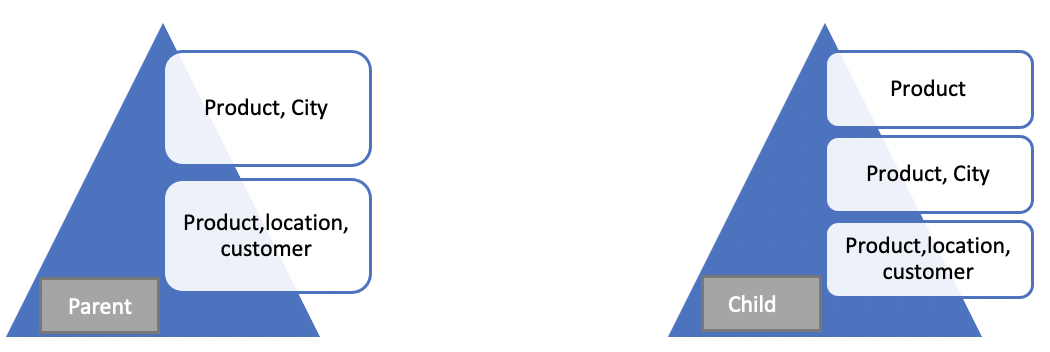
A pyramid forecast process is easy to implement and has been used to improve the forecast of more detailed data. In selecting a pyramid for the process, a good pyramid is all one needs – not an optimal pyramid. The selected pyramid can be used for forecasting until there are changes in either the attributes at the detailed level or trend changes.


