Last week I wrote about the potential benefits in forecasting results based on removing outliers from one-time events.
A key question that came up because of that post was this: How long does a change in demand as a result of an event (whether up or down) impact forecasts in the future?
Rather than theorize on this topic, I decided to run some simulations to see what happens with real data. What follows beyond the clarification below are simple results of the simulations that I ran.
Simulation Results: Effects of One-Time Events on Future Forecasting
A quick explanation upfront is in order: The number of permutations that are possible is infinite. For example, if an event shows a negative impact on demand over three months, then one can see a decline in any of these ratios.
| Example Code Name | Month 1 | Month 2 | Month 3 |
| E1 | -20% | -10% | -5% |
| E2 | -5% | -10% | -20% |
| E3 | -20% | -20% | -20% |
| E4 | -9% | -14% | -24% |
| E5 | … | … | … |
Further, the timing of these events can have an impact. For example, if we are using 36 months of time series data to forecast, and the event happened in Months 4 through 6, then the impact on the forecast might be minimal because a lot of more recent history being available after that. If on the other hand, the event happened in months 31 through 33, then it might have a stronger impact on the future forecast. This is shown in figure 1 below.
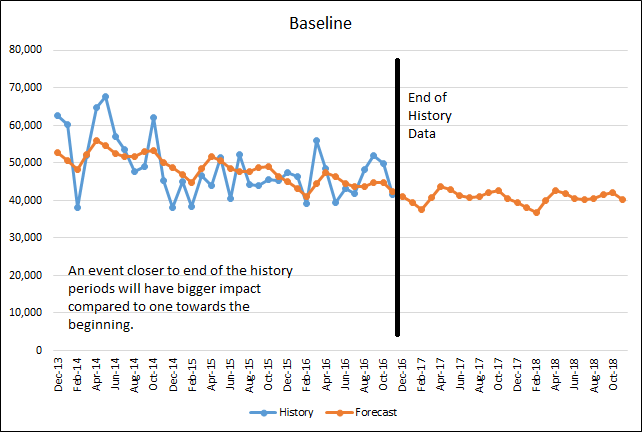
Figure 1
Related: The Effect of Currency Demonetization on Statistical Forecasting
Since we are talking about forecasting, the method selected will also have an impact.
So, with those clarifications out of the way, let us focus on an actual time series with real data. This data is from sales of an actual product. Look at Figure 2 below. History months are from December 2013 to November 2016, providing exactly 36 months of historical data. The graph also shows forecast data going out till Oct 2018. Looking at the chart, one can see that:
- The average value was about 50,000 units per month.
- The time series was on a slow decline with some seasonal trends and a low point in the month of February every year.
- The orange line in the months prior to December 2016 represents the fitted data; rest is the forecast.
To keep things simple, I used a web based implementation of the Holt-Winters method for this analysis.
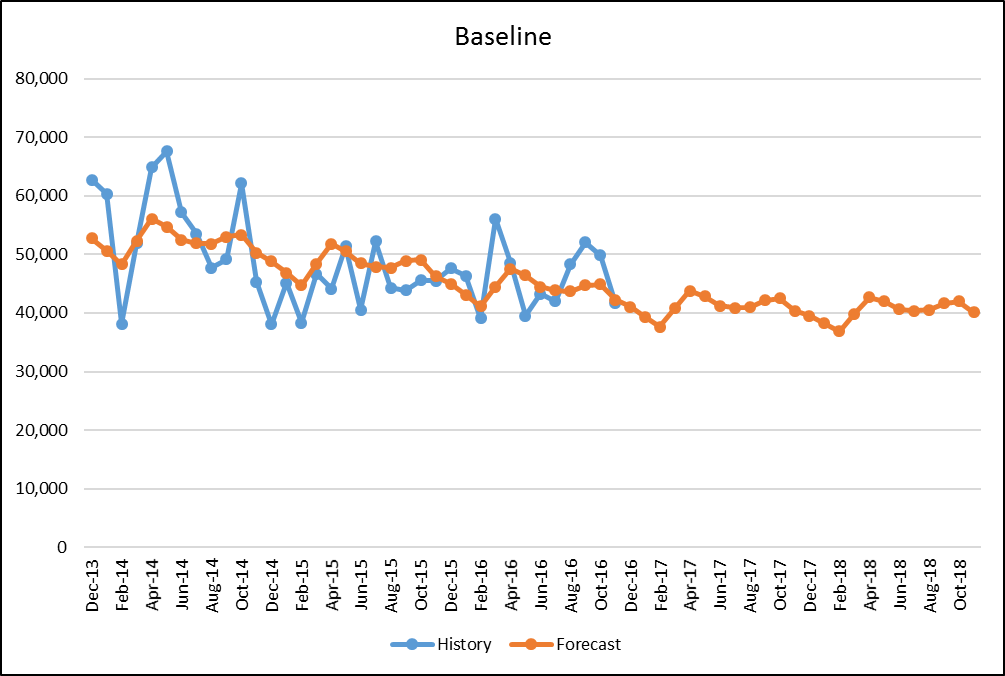
Figure 2
Now I simulated a 50% decline in April 2016. As you can see in Figure 3, resulted in a decrease in the future forecast of about 6% when averaged over six months.
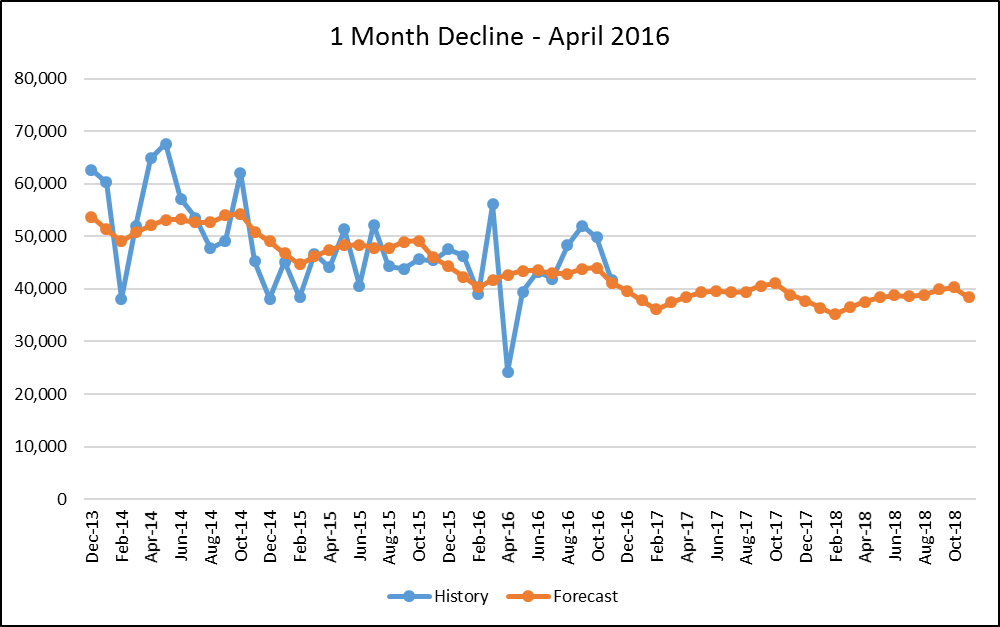
Figure 3
Read Also: Two Sides of the MAPE Coin
Repeating the simulation with two consecutive months of 50% decline, we see the forecasts go down by 11% as shown in Figure 4 below.
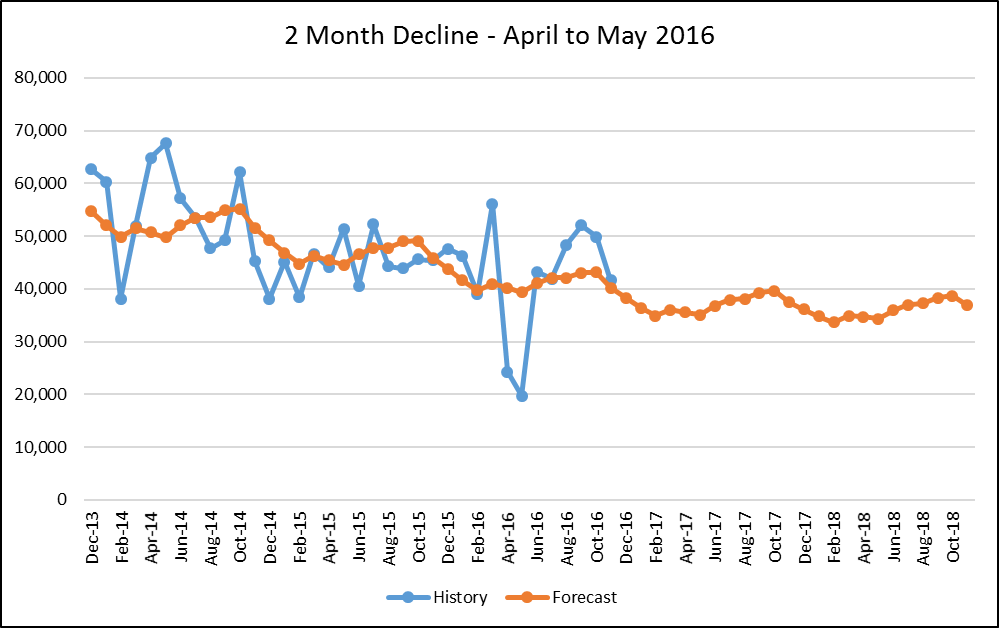
Figure 4
At this point, I had the spreadsheet working, so I simulated 3, 4, 5 and six months decline respectively. (One thing worth mentioning here: If the one time event is having a very long term impact (3-4-5-6 months meet this criteria in my mind), then one should probably do a double take on whether this is a one-time event or the new reality.) See charts below. No surprises here: The longer the length of the decline period resulting from an event, the lower the future forecasts. The table below summarizes the results.
| Length of Event Impact | Simulation Result |
| 1 Month | 6% |
| 2 Months | 11% |
| 3 Months | 15% |
| 4 Months | 18% |
| 5 Months | 23% |
| 6 Months | 28% |
The results here are very specific to my simulations, and the percentages mentioned above will probably not match any other time series. However, a general observation is that the idea that these one-time events can have a significant impact on the future forecast and as such necessitates a strategy to deal with them as outliers.
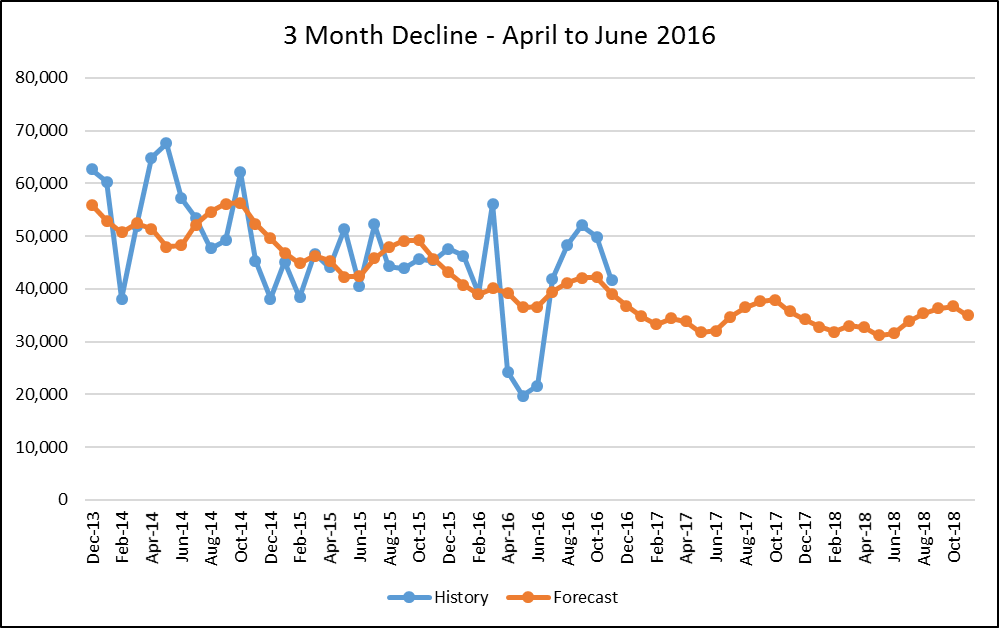
Figure 5
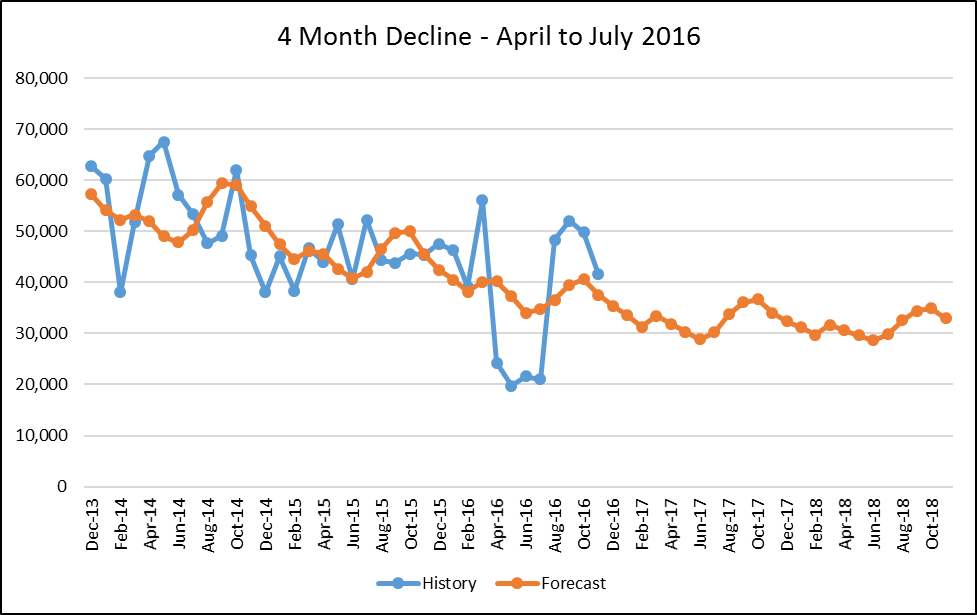
Figure 6
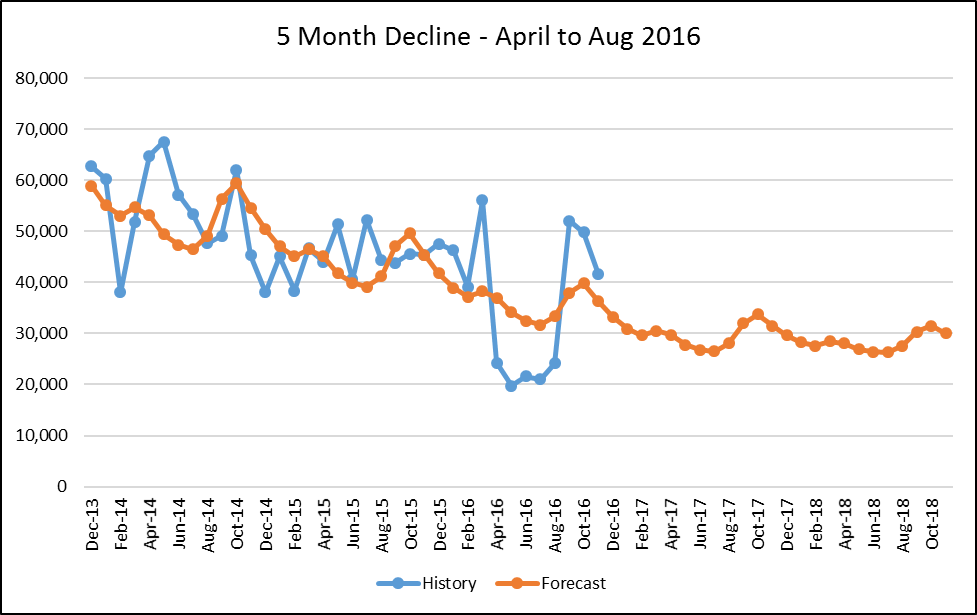
Figure 7
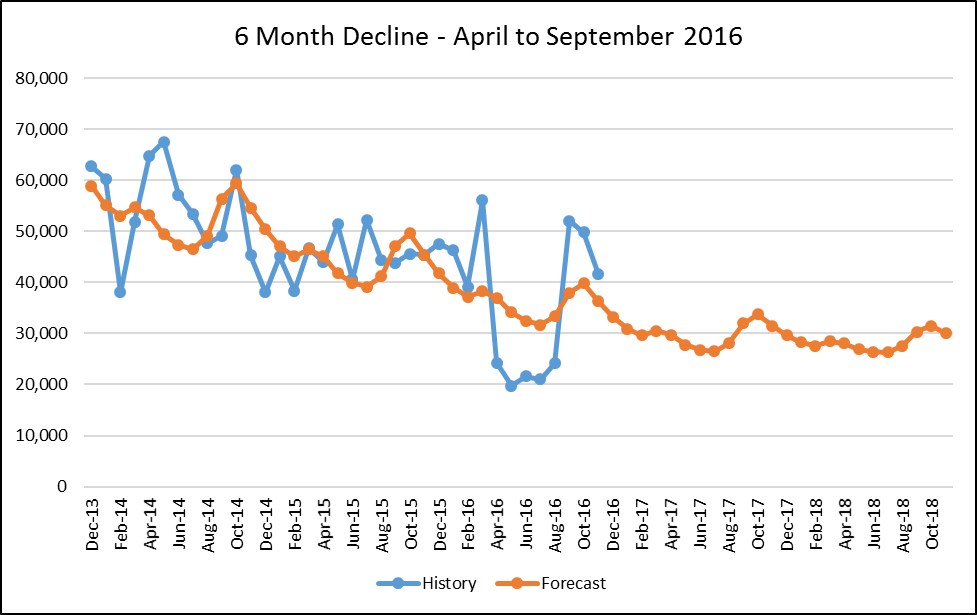
Figure 8
Enjoyed this post? Subscribe to the Arkieva Supply Chain Link Blog for updates on supply chain trends, news, strategies and insights.