Wondering how inventory is modeled in supply chain planning systems? Here’s what you need to know.
“All models are wrong; some are useful.” ~ Albert Einstein
Depending on the industry there is often a question on how to model inventory. For example, for businesses in industries where the freshness of the product is very important, there are often rules on how much shelf life a product should have when shipping to a customer. For such industries, customers will reject products that are more than a certain age, and the entire shelf life of product might not be more than a few days or weeks. As such, there is a great temptation to model inventory’s age in the planning system. Examples of products with short shelf lives include food products such as dairy, pharmaceuticals, among others.
In contrast, there are industries where the shelf life is much longer. For example, a chemical product might lose its potency over a long period, sometimes a year or two. In this entire time, it might be perfectly acceptable to ship the product to the customer regardless of the remaining shelf life.
Let’s look at a real-life example that all of us can relate to: if we are trying to get fresh fruit juice, we want it to be fresh to the point of the juice being extracted right in front of our eyes. However, if we are going to buy a book, a 1-day old copy has no advantage over a 10 or a 100-day old copy.
In real life, both these industries use First-In-First-Out (FIFO) principles at the time of execution. Meaning that all other things being the same, the customer will be given the product from older lots first as long as it is still within the remaining shelf life rules. These days, the availability of bar coding etc. has made keeping tracking of these lots and the relevant details much easier.
How to Model Inventory in Supply Chain Planning Systems
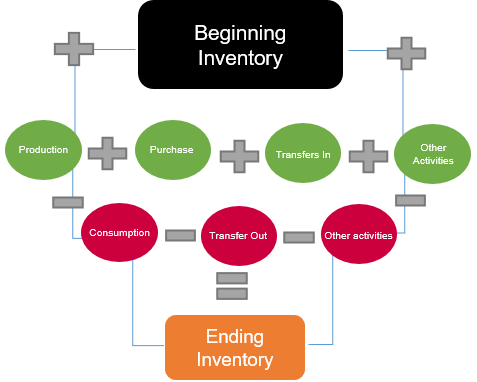
Regardless of the industry involved or the shelf life rules, supply chain teams building a supply planning model must deal with this equation:
Beginning Inventory
+ Production+ Purchase+ Transfers In+ Any other activity that adds to inventory
– Consumption – Transfer Out – Any other activity that takes away inventory
= Ending Inventory in that period
This equation holds true for any material, location, period (day, week or month). (At Arkieva, we call this the material balance equation.)

Now, let us come back to the question we started with:
How should we model our inventory in a supply chain planning system?
Should we:
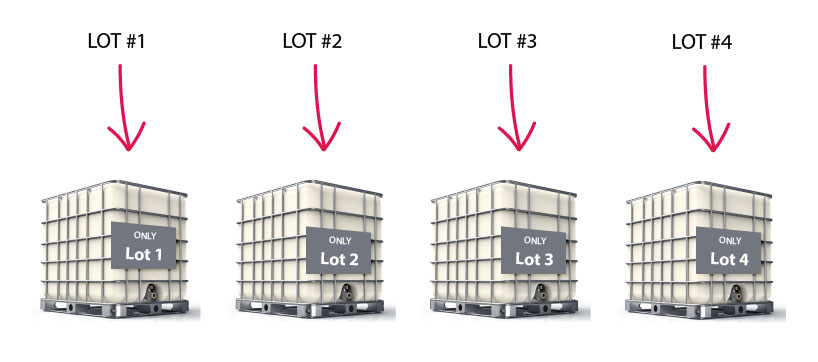
- Model inventory at the lot or at least the day level so that we can keep track of inventory by lot or at least by day as shown in figure 1 below. In this case, we force the model to use the older inventory first. As a result, a more enhanced engine needs to be utilized which keeps track of the inventory by proposed lot or at least by the proposed a date of production. In this case, the First-In-First-Out (FIFO) logic is enforced by the engine instead of assuming that this already the case. OR…

Figure 1- Each storage location contains material from only one (1) lot
- Model inventory at the aggregate level, and assume that the execution teams will ensure the use of the FIFO principles. In this case, the model should not plan too much inventory in the supply chain by defining appropriate inventory targets and feeding the same into the model.
There are situations where the first approach is necessary. However, in my experience, these situations are few and far between, and the approach comes at a high cost. The cost is that the model is much bigger and complex and can have longer solve times. I would always at least question if the cost is worth the benefits of building a much larger model in the planning system.
[You May Also Like: 3 Key Multi-Echelon Inventory Optimization Challenges and How to Overcome Them ]Is Inventory Modeling Critical Even in Industries with Long-Shelf Lives?
Even in industries where there are no real shelf life limitations, questions often come up on the topic of inventory modeling. This line of questioning is especially true for users of a Distribution Resource Planning (DRP) system. Very often, they are coming from a transaction system background and are expecting a system of tracing like with bar coding.
Some example questions are:
- How does this shipment planned by the system for seven weeks from now affect Safety Stocks (SS) or meeting demand? (It could be a combination, such as for multiple demands, or for demand and SS.)
- If it is coming from a warehouse, which can get the same product from multiple plants customers often ask: Is this shipment from the warehouse to the customer using product from plant 1 or 2 or 3? (It could be a combination of plants.)
- When (on what date) was, the product used in this shipment produced? (In reality, it could be a combination of dates.)
At the time of execution, these questions are easily answered based on the individual lot sizes shipped to the customer.
But how about the planning system?
To answer this question let’s first look at the goal of the planning model.
Is it for order fulfillment? Or making somewhat longer-term planning decisions about resources, be it work centers, labor, etc.?
For a classic example, think of a product going to a warehouse from different plants. Before a lot is completely used up, the next lot could show up.
There are two points to consider:
- In a transaction system, one would know exactly where each box came from. But in a planning system for most businesses, we only keep track of the total inventory, not the individual lots.
- Further, we are talking about future data. For future data, the production lots are not even known. We are producing based on quantities.
In short, in many cases, once the inventory comes to the storage point, there is no need to keep track of the source. Assuming a steady state flow, one imagines that the execution team will move the older product first, achieving a FIFO (First-In-First-Out) strategy. Or, if it is the end of the quarter (or other financial reason), they may pick a particular low cost batch.
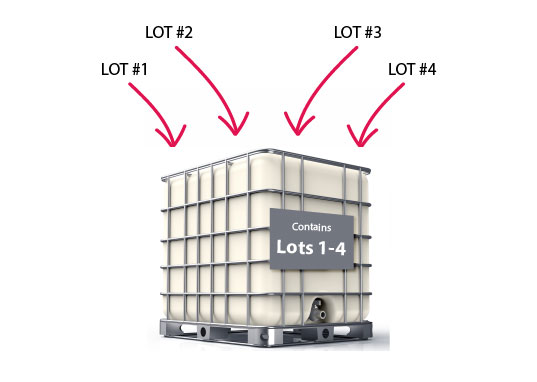
Looking at the picture below, supply is coming from different sources on different dates into the storage location. We then draw some inventory (products) to supply to a customer. You can think of this as the inventory being all mixed up inside the storage area as shown by the arrows in the image. As the planning engine draws some of the inventory, it comes out from the storage location containing lots 1-4, making it impossible to mark the source of the product.

Figure 2 – Storage location contains products from different lots (1-4)
Next, when we ship to the customer, we do not know what portion comes from which source or which date. We know we get product from the warehouse, but not the plant or production date.
Factors such as inventory targets allow a model to control the overall age of the inventory without modeling it in detail. So, for example, if the optimum age to which a product must be shipped out is two months, then a supply target of 1 month would ensure that we never have too much old product. We are of course assuming the steady inventory state as described above.
Is there a way to find inventory sources?
A pegging report meets this requirement using a soft pegging rule. In a pegging report, we ‘draw’ quick lines in the backward direction from the demand to see the source. The idea is to make First-In-First-Out (FIFO) connections (or pegs) in the model results. This means that the first demand will be satisfied by the first supply and so on. This creates the effect shown in the picture below.

Enjoyed this post? Subscribe or follow Arkieva on Linkedin, Twitter, and Facebook for blog updates.


