Introduction
Having a good forecast is essential to demand planning. It ensures the right goods are produced at the right time and reach the right customers. What’s more is that demand planning is situated at the start of your supply chain, playing an integral part in a streamlined supply chain.
At Arkieva, we believe that automated forecasting is very valuable. An automatically calculated forecast can establish a baseline when starting your forecasting cycle. It allows you to focus on the data that will yield the highest results. When manual forecasting yields low results, it is beneficial to let the data speak for itself and trust this automated baseline.
To illustrate this, we use the Forecasting Quadrant:
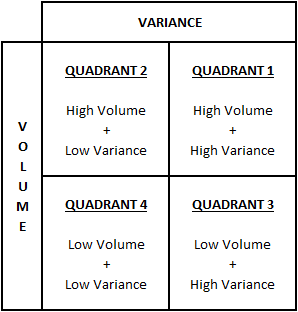
The left quadrants are forecastable due to a low variance. While it’s easier to reach a good accuracy here, the automated forecast can predict this forecast reasonably well. The forecast improvements made here due to manual input will therefore lead to smaller improvements in the overall accuracy. Thus, the suggestion is to trust the baseline for these combinations.
Quadrants 1 and 3 are a different story. Quadrant 3 is difficult to forecast but, due to its lower volume, using a production strategy like MTO (make-to-order) could lead to less waste and stock. Quadrant 1 is the section where the manual input of a sales or demand team is invaluable. The high variability means that statistical forecasts are less able to predict a trustworthy outcome. While it’s still a good idea to use the automated forecast as a baseline, manual input based on customer data could lead to high forecast improvements here.
Automated Forecasting and Choosing the Forecast Level
Now that we know the value of an automated forecast, we run into the main question: how to set up an automated forecast. More information on this can be found in one of our blogs: https://blog.arkieva.com/automated-forecasting/
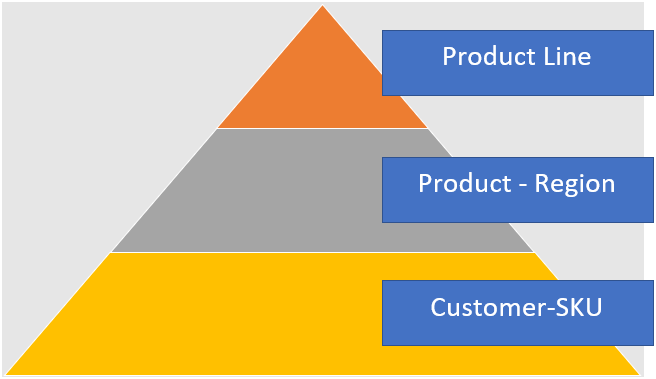
The discussion to be had is what level, or better yet which levels, should be used. Ask the sales team and they will say to look at the customer level. Ask the supply team and they will require the forecast to be given at an aggregated product level. Distribution will mention that the customer location should be considered. If we want to include the forecast in our S&OP process, then we require all teams to discuss the same data which means that the forecast needs to be based on a handshake to be relevant for all teams. If we know which data items are of value for the different teams, we can start arranging this in a forecasting pyramid where we work from low to high level.
Example
Let’s say our dataset has “Customer – SKU” as the lowest level. Using this as the first step in automated forecasting will give each combination a certain volume. At this detailed level, the volume itself is not relevant but it distributes a weight to each combination. We now have an idea, based on historic sales, which “Customer – SKU” combinations are most probable and the expected distribution that will satisfy the sales team.
Now we can go a step higher. It’s useful for distribution to be able to follow preferred routes to the customers. This can be achieved by manufacturing the products closer to the customer, if possible. Calculating the forecast again at a “Product – Region” level might provide the information needed. Calculating the forecast at this level adds a new layer to the distribution, so we know where the most beneficial places are to create the product. This, combined with the pre-existing weight on the “Customer – SKU”, further fine tunes the weight originally given. Now we’ve reached a level the distribution and sales teams can agree on.
Finally, we need to have a high level. We know where to place the volume, but we need aggregated data to calculate what volume to distribute. The production team, for example, wants to know which volumes are expected and for which product lines to be able to start planning. For this, we calculate the forecast a final time on “Product Line” and use the previously calculated weights for “Product – Region” and “Customer – SKU” to distribute the volume to each specific lowest level combination. This adds the production team to the parties that could agree on the forecast.
Whether or not these levels are sufficient depends on how high the highest level is. If the highest level chosen is still detailed when looking at the total dataset, it is worth adding a final level to the pyramid. This last step should be the level which is most beneficial for applying statistics and calculating the forecast.
Conclusion
Finding the ideal forecast level does not mean finding the specific combination that gives you all information you need. Rather, it’s finding a handshake between all teams involved with demand planning and taking their interests into account.
To reach this you need to follow 3 steps:
- Find the combinations that are important for each team
- Organize them from low to high level
- Review if a final level needs to be added