Demand planning involves using historical sales data to generate forecasts for different items throughout the supply chain. A successful demand planning process accurately forecasts demand and revenue streams, and subsequently drives the next steps in the S&OP (Sales and Operations Planning) process which are Inventory, Supply Planning, and Optimization. Therefore, it is a crucial step in an organization’s S&OP process.
Modern supply chain networks contain complex distribution networks with multiple nodes at various geographical locations and demographics. Additionally, there could be multiple SKUs with seasonal variations – eventually generating a complex and diverse data set that needs to be carefully considered for effective demand planning. The S&OP process requires the future demand picture to effectively plan future operations. So, a step in the demand planning process is forecasting future demands.
Demand forecasting provides a lot of challenges that range from what method, or set of methods, are appropriate for specific data to ensuring the method selected has the right parameter settings for the specific data. Forecasting provides automation opportunities from method selection and optimal parameter selection to steps for improving forecasting.
[cta id=”4988″ vid=”0″]
Forecasting requires a good understanding of data. This allows it to be classified into categories such as seasonal, intermittent, etc. Classification may also be associated with a specific method or methods. So, with the classification, one can reduce the number of methods down to a set of methods that are likely to provide a quality forecast.
A forecasting method may have parameter(s) that are required to obtain the best result from the method. The choice of these parameters may be different for each time series. Therefore, there is a need to select the parameters so that it produces the best quality forecast for that method. This is repeated for each method and then the output of the best method is selected. The quality of a method is determined using an error measure. There are several error measures to choose from – the common ones are Mean Absolute Deviation (MAD), Weighted Mean Absolute Percentage Error (WMAPE), Mean Squared Error (MSE), and a few others.

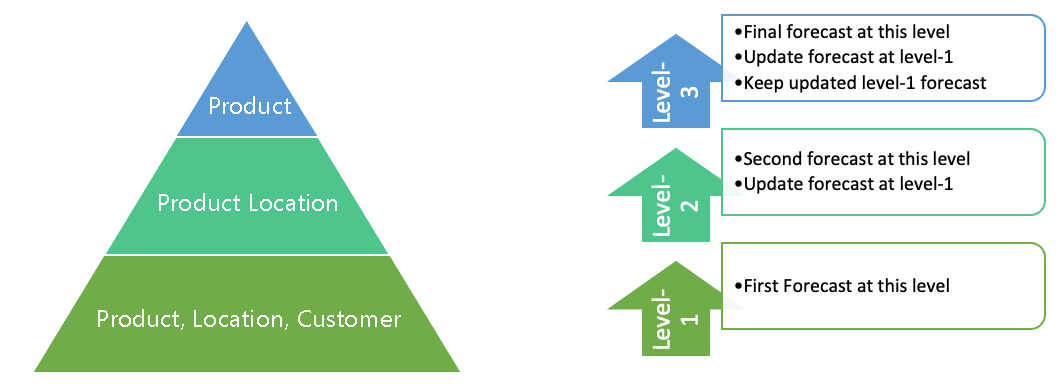
Normally, the more detailed the data is, the less accurate the forecast is. Conversely, the less detailed the data is, the more accurate the forecast. A demand planner may prefer a level of detail that perhaps does not meet the desired level of accuracy. One of the many ways to improve the forecast is to construct a pyramid consisting of 2 or more levels.
The pyramid is constructed one level at a time. The forecast starts at the lower level and moves up towards the top. After each forecast at a level, the detail level is updated. The goal is to find the pyramid with the right levels that improve the quality of the forecast.
Finding the right pyramid can be time-consuming and requires analyzing large volumes of data and experimenting with different levels of detail at each level. It may take time and resources to get the right pyramid.
The process of forecasting a time series data is repeatable and a pyramid can be logically constructed and the quality measured. So, the process of constructing pyramids and forecasting can be automated. Multiple pyramids can be constructed very quickly, and the quality of each pyramid compared to other pyramids and the best pyramid selected. Strategies can also be created to quickly find the optimal pyramid and avoid pyramids that are least likely to produce a quality forecast.
In our upcoming webinar, Supply Chain Management – Exploring the Self-healing Capabilities of an Automated Supply Chain System, we will explore areas of the supply chain that have promise for automation and evaluate the benefits and challenges of process automation. Hope to see you there!

About the Author: Alfred Degbotse
Alfred Degbotse is a Senior Analytics Consultant at Arkieva. Alfred spent 20 years of his early career with IBM prior to joining Arkieva. While with IBM, he worked in areas of supply planning and business analytics. He also has numerous granted patents in Supply Factory Planning Solutions. Alfred earned his Ph.D. in Operations Research from Virginia Tech.

About the Author: Venkat Nagasubramanian
Venkat joined Arkieva as a consultant in 2017 with experience in the design and implementation of optimization models, supply planning solutions, production scheduling, and project management. He holds M.S. degrees in Manufacturing Systems Engineering (focus on Operations Research and Decision Sciences) from the University of Wisconsin – Madison. In his free time, Venkat enjoys biking, playing soccer, and reading novels.