In this week’s What-if Wednesday post, Arkieva Supply Chain Optimization Consultant – Abhishek Shah – shares the results of a what-if demand forecast simulation using the gamma multiplicative forecast parameter of the Winters forecasting method.

In the previous blog, we experimented with Beta – the trend parameter of Holt-Winters Multiplicative method – to see how the forecast gets affected as the weight changes from 0.05 to 0.8.
This week we are going to run similar tests with Gamma, the seasonal parameter. We will use the same historical data set for our analysis. Similar to Alpha and Beta, Gamma values range from 0 to 1; and larger Gamma means more weight on recent historical seasonality.
For our analysis, we will keep the alpha and beta values at 0.05 each and will vary the Gamma values from 0.05 to 0.8 to evaluate how the forecast changes. You can see the numbers at the end of the post.
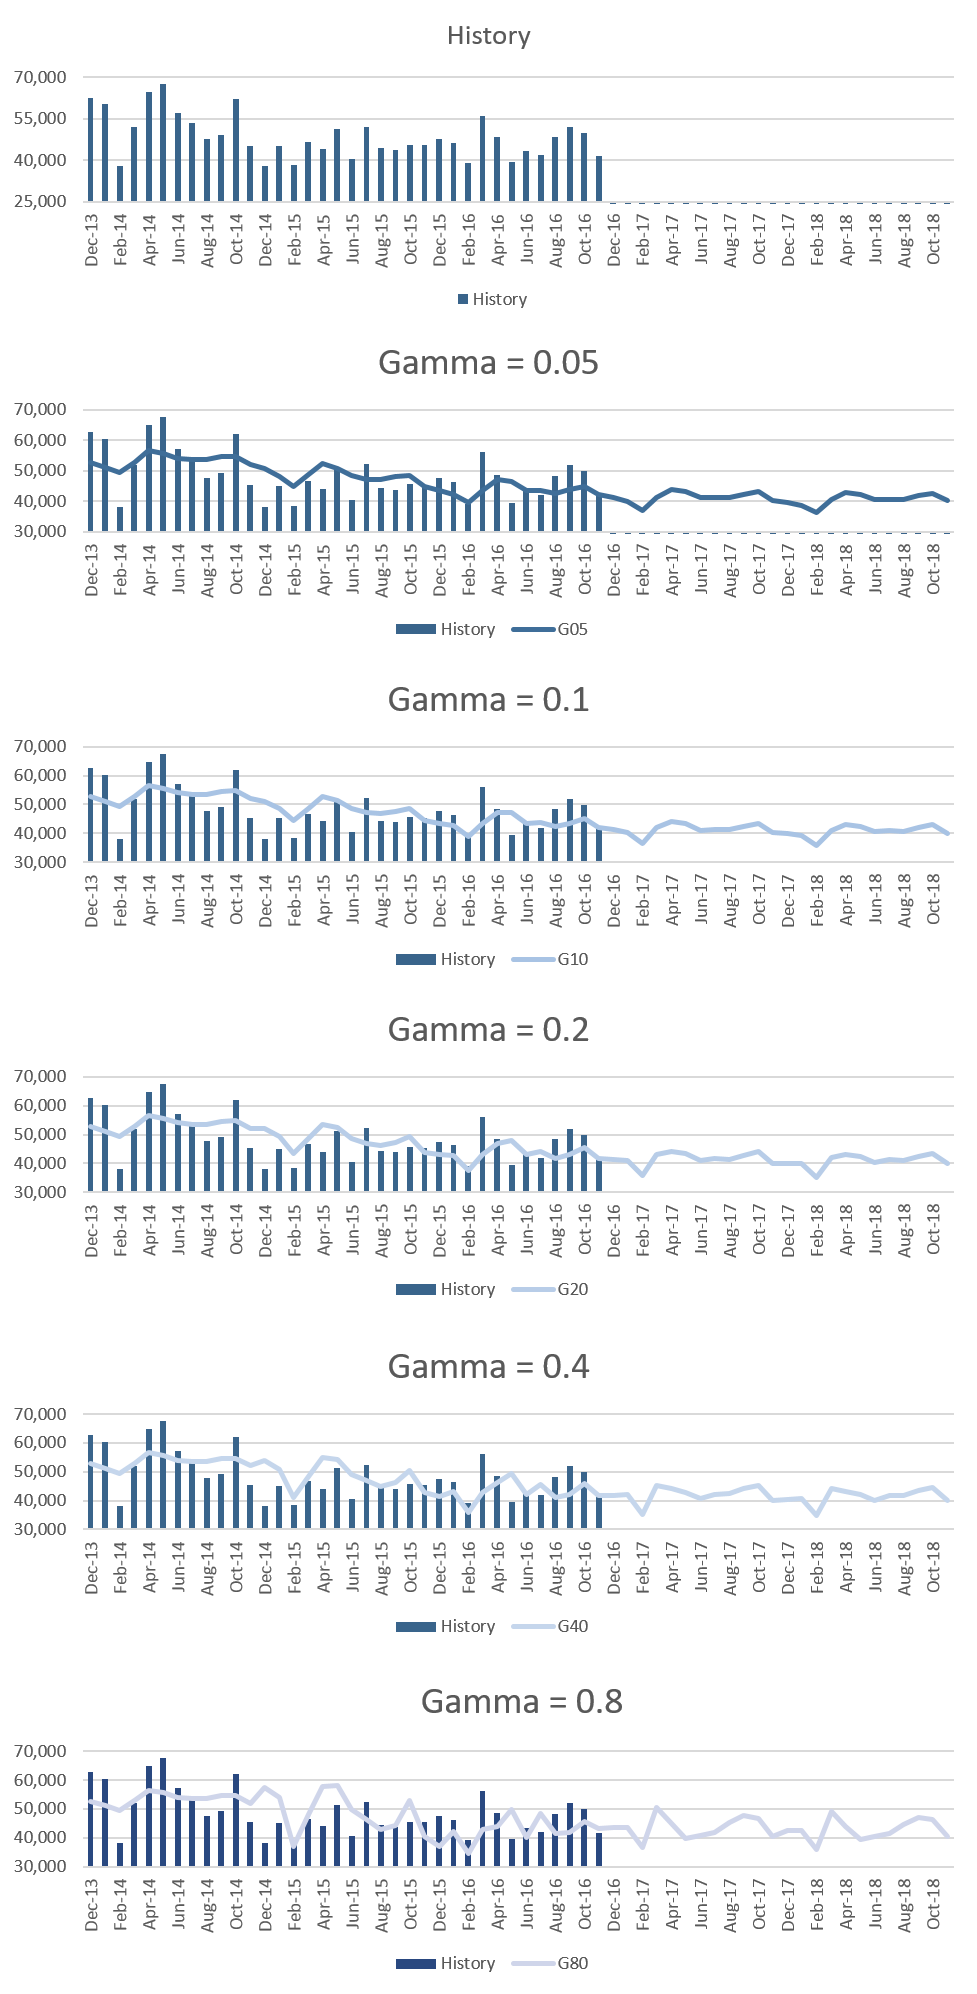
The first chart below shows historically observed values from the last three years and the subsequent graphs represent forecasts using a Gamma value of 0.05, 0.1, 0.2, 0.4, and 0.8.
Statistical Forecasting Method: Holt-Winters Multiplicative Gamma Parameter Simulation Results
The overall behavior of the forecast with changing gamma is similar to what we saw with the additive method in the previous blog. There is little change in the seasonality of the forecast when Gamma values range from 0.05 to 0.4 but we notice that there is an uptick in the month of Mar’17 and Aug’17 as Gamma goes up to 0.8 which clearly indicates the influence of last one-year history (Mar’16). Also, just like the alpha and beta values in the multiplicative method, the seasonal changes, as we change gamma parameter from 0.05 to 0.8, are proportional to the level and not constant. You can compare the forecast from the previous method here.
What-if Scenario Forecast Numbers
| Month | History | Month | ForecastG.05 | ForecastG.1 | ForecastG.2 | ForecastG.4 | ForecastG.8 | |
| Dec-13 | 62,719 | Dec-16 | 41,248 | 41,326 | 41,462 | 41,789 | 43,721 | |
| Jan-14 | 60,312 | Jan-17 | 39,915 | 40,318 | 41,014 | 42,065 | 43,612 | |
| Feb-14 | 38,119 | Feb-17 | 37,090 | 36,554 | 35,774 | 35,195 | 36,506 | |
| Mar-14 | 51,926 | Mar-17 | 41,412 | 41,927 | 43,009 | 45,346 | 50,492 | |
| Apr-14 | 64,856 | Apr-17 | 43,968 | 44,038 | 44,132 | 44,227 | 44,827 | |
| May-14 | 67,589 | May-17 | 43,173 | 43,292 | 43,325 | 42,689 | 39,633 | |
| Jun-14 | 57,151 | Jun-17 | 41,235 | 41,089 | 40,847 | 40,557 | 40,791 | |
| Jul-14 | 53,502 | Jul-17 | 41,233 | 41,417 | 41,747 | 42,192 | 41,778 | |
| Aug-14 | 47,696 | Aug-17 | 41,134 | 41,181 | 41,425 | 42,389 | 45,259 | |
| Sep-14 | 49,189 | Sep-17 | 42,343 | 42,458 | 42,842 | 44,109 | 47,811 | |
| Oct-14 | 62,103 | Oct-17 | 43,111 | 43,498 | 44,186 | 45,268 | 46,822 | |
| Nov-14 | 45,289 | Nov-17 | 40,362 | 40,228 | 40,077 | 40,108 | 40,530 | |
| Dec-14 | 38,105 | Dec-17 | 39,785 | 39,872 | 40,033 | 40,414 | 42,397 | |
| Jan-15 | 45,149 | Jan-18 | 38,784 | 39,164 | 39,830 | 40,865 | 42,477 | |
| Feb-15 | 38,361 | Feb-18 | 36,398 | 35,922 | 35,233 | 34,749 | 36,061 | |
| Mar-15 | 46,655 | Mar-18 | 40,473 | 40,953 | 41,967 | 44,174 | 49,117 | |
| Apr-15 | 44,090 | Apr-18 | 42,916 | 42,994 | 43,112 | 43,270 | 43,992 | |
| May-15 | 51,350 | May-18 | 42,303 | 42,424 | 42,484 | 41,968 | 39,291 | |
| Jun-15 | 40,574 | Jun-18 | 40,641 | 40,519 | 40,323 | 40,110 | 40,441 | |
| Jul-15 | 52,236 | Jul-18 | 40,717 | 40,894 | 41,217 | 41,675 | 41,420 | |
| Aug-15 | 44,306 | Aug-18 | 40,695 | 40,747 | 40,989 | 41,917 | 44,685 | |
| Sep-15 | 43,866 | Sep-18 | 41,842 | 41,957 | 42,328 | 43,535 | 47,084 | |
| Oct-15 | 45,607 | Oct-18 | 42,581 | 42,941 | 43,589 | 44,633 | 46,212 | |
| Nov-15 | 45,457 | Nov-18 | 40,144 | 40,031 | 39,912 | 39,980 | 40,456 | |
| Dec-15 | 47,582 | |||||||
| Jan-16 | 46,313 | |||||||
| Feb-16 | 39,110 | |||||||
| Mar-16 | 56,107 | |||||||
| Apr-16 | 48,553 | |||||||
| May-16 | 39,483 | |||||||
| Jun-16 | 43,245 | |||||||
| Jul-16 | 41,954 | |||||||
| Aug-16 | 48,323 | |||||||
| Sep-16 | 52,052 | |||||||
| Oct-16 | 49,837 | |||||||
| Nov-16 | 41,619 |
So, in businesses where there have been quite some changes within the last one year that impacts seasonality – for example: acquired new customer or added another product line – which would continue in the subsequent years, then we might want to use higher values of Gamma so that the seasonality from the recent year is captured in the forecast moving forward.
Enjoyed this post? Subscribe or follow Arkieva on Linkedin, Twitter, and Facebook for blog updates.