Seasonality forecast simulation: what is the effect of changing the gamma parameter in Holt-Winters forecasting method?
For many manufacturing businesses, seasonality affects near and long term forecasts. To create a more accurate forecast, there is need to experiment with multiple forecasting scenarios to determine how changes in inventory levels could potentially affect business operations and bottom line results.
Key questions that can be answered from a forecast simulation based on a seasonality analysis include:
- How can I incorporate changing seasonality with my current business plan?
- How can I account for market volatility?
- Were there any recent unusual increases or decreases in demand?
Read Previous: What-if Wednesday: Forecast Simulation – Changing The Beta Parameter in a Forecasting Method
Forecast Simulation – Gamma Parameter (The seasonal Parameter)
In the previous What-if Wednesday blog, we experimented with Beta – the trend parameter of Holt-Winters method – to see how the forecast gets affected as the weight changes from 0.05 to 0.8.
This week we are going to run similar tests with Gamma, the seasonal parameter. The goal of this analysis is to help forecasting teams collaborate and improve forecast accuracy considering both future and past demand or market changes.
For the purposes of this analysis, we will use the same historical data set that we used in our previous posts for our analysis. Like Alpha and Beta, Gamma values range from 0 to 1; and larger Gamma means more weight on recent historical seasonality.
For our analysis, we will keep the alpha and beta values at 0.05 and will vary the Gamma values from 0.05 to 0.8 to evaluate how the forecast changes. The numbers are in the table below.
The first chart below shows historically observed values from the last three years, and the following graphs represent forecasts using a Gamma value of 0.05, 0.1, 0.2, 0.4 and 0.8.
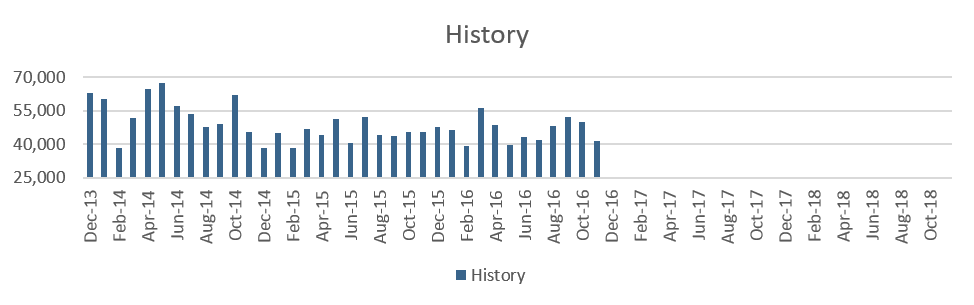
Figure 1
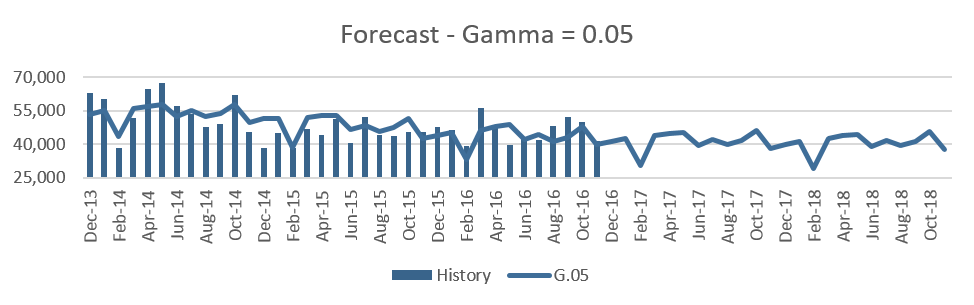
Figure 2
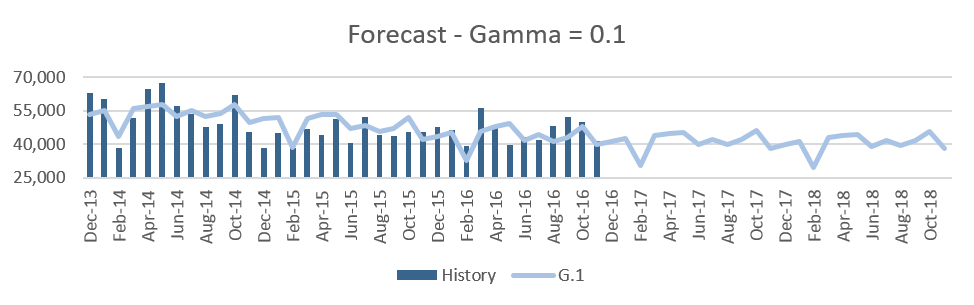
Figure 3

Figure 4
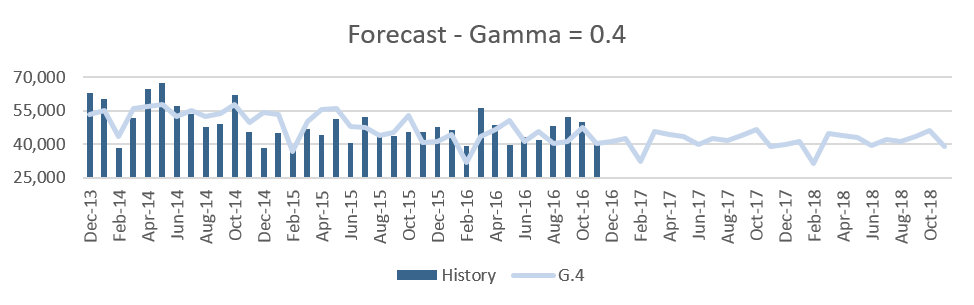
Figure 5
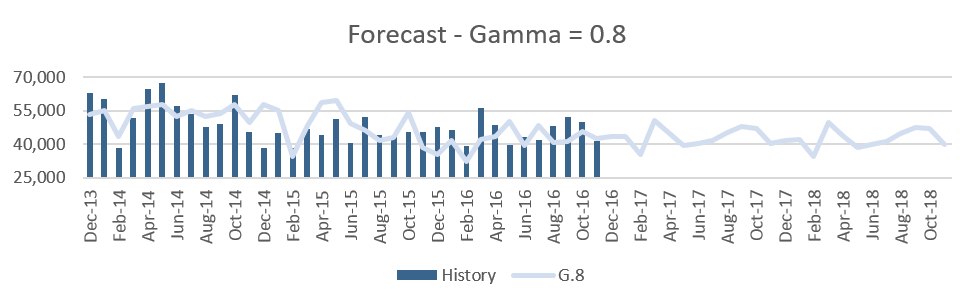
Figure 6
We observe that as the Gamma values change from 0.05 up to 0.4, there is minimal change in the seasonality of the forecast. When it is 0.4 we see a little uptick in the month of Mar’17 and Aug’17 and as the Gamma value goes up to 0.8, the months of March and August in 2017 have high peaks. This clearly indicates that these months have been influenced the most by the last one-year history since the historical data in Mar’16 has a peak and Mar’15 and Mar’14 do not have any prominent peaks. The same happens with August 2017 and 2018.
We can get a more noticeable change in the forecast with smaller gamma values if we have more years of historical values. Lower values of Gamma do not depend so much on the recent one or two years of seasonality. Typically, we use 3 years of data which in fact is good enough to capture seasonality for forecasting purposes, but in that case, if we want to pick up the seasonality from the most recent year we need to use gamma values that are at least higher than 0.4.

How does this simulation affect my forecast?
So, in businesses where there have been quite some changes within the last one year that impacts seasonality. For example, if the business acquired a new customer or added another product line – which would continue in the subsequent years, then we might want to use higher values of Gamma so that the seasonality from the recent year is captured in the forecast moving forward.
Want to join in our What-if-Wednesday posts? Add a comment below or send a tweet to @Arkieva with #WhatifWednesday, or email editor@arkieva.com to suggest a topic, scenario or simulation that you would like us to discuss.