Of late, I have seen a lot of discussions about the right formula to use when measuring forecast accuracy. I have written about things like MAPE, WMAPE, BIAS, etc.; the implication of course is that the right formula should give you a better understanding of the forecast accuracy picture. I agree with the idea of using the right formula(s). However, from time to time, I am reminded that an equally bad (if not worse) culprit in publicizing wrong forecast accuracy in businesses has to do with the level at which the accuracy is calculated. A telltale sign for me is that in the early parts of a discussion with a prospect, I would ask about the current forecast accuracy and I would get an answer in the 95-98% range.
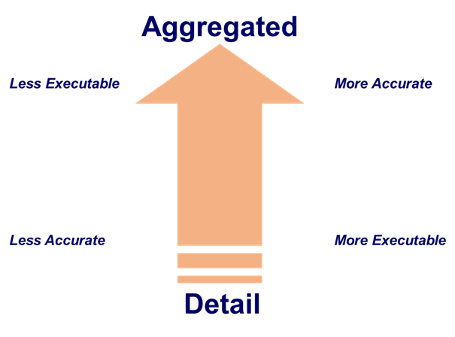
In forecasting that is done to plan the supply chain, as well as when measuring forecast accuracy, the level of aggregation is very important. If you measure at too high a level, your accuracy picture will look better than what it needs to be as the data at high (aggregated) levels is more forecastable. By contrast, at too low a level, the accuracy will be low because of the noise present in the data at low (detailed) levels of aggregation.
Read More: An Approach to Setting Forecast Accuracy Targets
As data is aggregated, random errors tend to cancel each other out. This makes the prediction more accurate. However, very aggregated forecasts are not that useful for planning capacity or production. The challenge is to develop an aggregation that is reasonably accurate and yet is useful for planning. This is summarized in the picture below.

Let us look at 3 different ways people make the mistake of measuring and reporting forecast accuracy at too high a level.
Dollars versus Units
Sales teams’ compensation is often tied to meeting quotas or sales targets. These targets are typically in dollars (or other relevant currency). As a result, when it comes time to forecasting as well as measuring accuracy, the instinct is to do it in dollars. So, they want to forecast $2 million worth of business and then try to get that many dollars in. Very often, by controlling different levers, they can get very close to this dollar forecast. But is it really helping the business’s supply chain?
The problem is that while dollars are fungible, the individual products are not. Products require different machines, raw materials, labor, and time to be produced. Supply chain needs to have the right product ready when the demand arrives. Thus, this dollar forecast, while accurate is not useful to the basic supply chain goal of getting the right product at the right time. One would have to have high inventory costs to meet the target service levels.
The remedy here is obvious: measure forecast accuracy in units, not in dollars.
Multiple Periods versus One Period
Some companies would measure and report forecasts at time-period aggregation, such as quarters or years. However, as we combine the data of various small periods into one large period, the same aggregation effects show up. Pluses cancel out the minuses resulting in a very good forecast accuracy measure. But is this helpful to the supply chain’s goal of making products available at the right time?
The issue is the product needs to be made available when the customer needs it. Aggregating to a big time-bucket detaches the forecast from this reality. The elevated forecast accuracy score could be accompanied with a poor service level or a high inventory cost. This is obviously not acceptable.
Read More: Relationship Between Forecast Accuracy and Safety Stocks
The remedy in this situation is to measure forecast accuracy at the right level of time aggregation depending on the use case. For most companies, this is weeks or months.
Family versus SKU versus SKU-Location
The above two examples of aggregation are relatively rare these days. However, I can say from personal experience that this third kind is still quite popular. In this situation, forecast accuracy is reported at a high level of aggregation in one or more of the product/customer/location hierarchies. For example, product family level or country level, or business level. No company would be looking to invest in a demand planning solution if their forecast accuracy was already that good.
The concern here is that when the customer comes asking for a certain product, we need to be ready to supply that product. It is not helpful to have some other product from the same product family. Or the same product in a different location in the same country. Thus, the right level of aggregation in forecasting and measuring the accuracy is key to having the right product at the right location.
The remedy, in this case, might depend on the type of business we are working with. Here are a few things to consider.
- If product one sells is customer-specific
- Product-Customer level
- Products that are so bulky, poisonous, or perishable that proximity dictates where they must be made, or when logistics costs are very high
- Product-Location Level
- If the logistics cost is outweighed by manufacturing cost and the focus is on optimizing the use of all production facilities and minimizing manufacturing costs
- Product Level
- If you Assemble to Order or practice Postponement
- Bulk or Stored Product level
In conclusion, it is important to measure and improve the forecast accuracy at the right level of aggregation. Otherwise, one can get fooled by an overly rosy picture of forecast accuracy.
What has your experience been in this area? Please share your thoughts
Enjoyed this post? Subscribe or follow Arkieva on Linkedin, Twitter, and Facebook for blog updates.


