Summary
In developing COVID-19 policies and managing supply chains the constant drumbeat is “data-driven decisions” where the new high priests are data scientists. Data by itself is not sufficient, the missing critical success factor is “models” to project the impact of decisions. One critical area for COVID-19 public policy is understanding the impact of different group sizes on the spread of COVID-19. This blog will provide a few examples of being “COVID-19 data adrift without operations management” and illustrate that a simple model that can be coded in a few hours provides more insight than is possible with just data for the group size question.
Introduction
In developing COVID-19 policies and managing supply chains the constant drumbeat is “data-driven decisions” where the new high priests are data scientists and epidemiologists. A recent post by Kinaxis observed the high priests often remain sequestered working on their algorithms and perhaps they would have more value getting out and learning the application area. A rule taught to every OR/MS graduate in the 1970s.
With the uptick in COVID-19 numbers (positive cases, estimate number of people with active COVID-19, all components of hospitalization and treatment, and serious outcomes), the challenge of reducing interactions between people (hence the spread) while minimizing disruptions to economics, education, and social health is again a regular topic of discussion and active policy area for government and public health organizations resulting in guidelines and trigger points to limit the spread of COVID-19. As in the early months of COVID-19, there is a preponderance of “hide behind the data” without doing the heavy lifting of gauging impact.
This blog will briefly review some examples of being “COVID-19 adrift” with just data and then focus on the primary task – demonstrating how modeling can be used to understand the impact of group size on COVID-19 spread.
Being adrift when you only have data and not understanding
One of the most common triggers used by public health officials is if the number of positives exceeds some thresholds, then mitigation actions are implemented (often closing in-person schooling, reductions in dining inside, closing some businesses, etc.). The best example of being “adrift” is NYC Mayor Bill de Blasio’s 3% trigger point on when to close all NYC schools – which just resulted in all NYC schools closing, despite limited breakouts in the school system itself. This one size fits all approach is getting push back for not doing the hard work of effective operations management. This case for “being only data-driven” as a path to disaster becomes clearer with revelations such as
- New York City and New York State measure COVID-19 positives differently
- Other areas of the country, for example, Michigan, have had success in keeping schools open for in-person education
- There are some studies suggesting in-person education can be done safely
The final piece of evidence of the importance of operations management appears on Sunday 11/30/2020 when NYC backtracks from a full closure.
Additionally, the current mantra is small gatherings are driving the surge, with little or no modeling to gauge the impact, this has generated push back and a loss of confidence. One of the best is in Vermont where neighbors are forbidden to chat with each other outside even when they have masks on and are 12 feet apart based on the recent addendum to an executive order. The primary data sighted to justify this action was a recent 50% increase of COVID-19 on a very small base over a short period of time (23 to 47 to 72 to 109) without the mention or thought of using any type of detailed modeling or acknowledging most early exponential growth is dampened by boundary conditions.
The recent Supreme Court decision limiting the ability of public health officials to put restraints on religious gatherings demonstrated that the same data was used to support varying views on all of which claim to be logical.
One thing is clear – workload on hospitals and health care professionals with respect to treating COVID-19 is growing quickly while this same group must get the logistics of advanced treatments such as monoclonal antibodies which require infusion and vaccines into smooth working progress. As the semiconductor industry is familiar with “science/engineering” without logistics (broadly defined) is of no value.
Using modeling to gain insight into why limiting the size of gatherings can reduce the spread of COVID-19
Keeping the size of gatherings down is one of the most common public health recommendations. For example, in elementary and preschools that often have 20 children in a class, the class size is reduced to 10 or 8 and all interactions with the other classes are limited (no shared playground time). Another example is limiting the size of indoor gatherings to 10. A question that I have been asked: why is this of value?
To provide insight, I wrote a simple model to mimic the spread of COVID-19 using the method Monte Carlo Discrete Event Computer Simulation (MCDESC) described in a previous blog.
Step 1 is capturing the flow of events.
-
- Establishing assumptions
- The population size of my town is fixed and no one new is allowed and no one is allowed out. There is a set number of people in the town with COVID-19 that are able to spread COVID-19.
- For this example, the population size is 100.
- Two out of the 100 have COVID-19.
- We assume once a person has COVID-19 they can spread it for the entire duration of the model run (yes, we could add logic for a person to get better, pass away, or be isolated).
- The population size of my town is fixed and no one new is allowed and no one is allowed out. There is a set number of people in the town with COVID-19 that are able to spread COVID-19.
- Decide on the group size to evaluate (for example 4) creating a random group of this size from the population.
- For each group created we evaluate the group to assess its ability to spread COVID-19.
- If no one has COVID-19 in the group, there is no spread, and nothing in the population changes.
- If everyone has COVID-19 in the group, there is no spread, and nothing in the population changes.
- If some of the people in the group have COVID-19 and others do not, then some of the COVID-19 free are now COVID-19 spreaders and their status is changed in the population.
- With the adjustments to the status of the population in place, another random group is created, evaluated, and population status updates made.
- The creation of the sequence of groups ends based on the value specified (here 120). The key data generated is the number of COVID-19 positives in the population after each group is selected and evaluated.
- For example, when the group size is 4, for one sample the first 29 groups have the following sequence of the number of COVID-19 positives in the population:
- 2 2 2 2 3 3 3 3 3 3 5 5 6 6 6 6 6 6 6 6 6 6 6 6 6 9 9 12 12
- This flow is repeated to create sample data (here 95 samples).
- For each group created we evaluate the group to assess its ability to spread COVID-19.
- Then a different group size is selected to evaluate (here 16).
- Establishing assumptions
Step 2 is understanding the raw source data from the model.
In this example, the group sizes investigated are 4 and 16, for each group size the number of positives out of 100 is captured after each group is randomly created (120 here) and evaluated for spread.
Figure 1 has the number of COVID-19 positives for group size 4 plotted for 4 of the 95 samples. The X-axis is the number of random groups created. The Y-axis is the number of positives in the population after a group is evaluated. The black line is the “50 marker”, where 50 out of 100 of the population are now COVID-19 positive. This graph displays the slow growth and variable between samples.
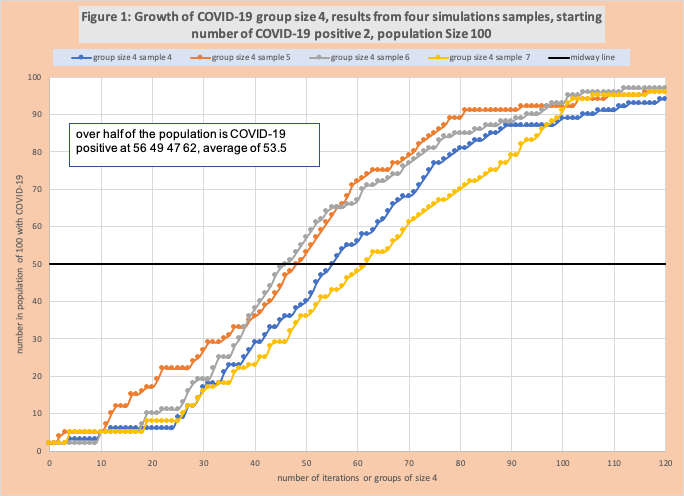

Figure 2 has the same information for group size 16. The contrast with Figure 1 is clear, each group gets to 50 quickly, despite both starting with just 2 COVID-19 positives.
Step 3 is developing a summary metric that is relevant to the key business question.
For each sample within each group size, we can easily calculate the number of groups needed to get to over 50 in the population that are COVID-19 positive. In figure 1 the four samples exceed 4 at 56, 49, 47, and 62 groups with an average of 53.5.
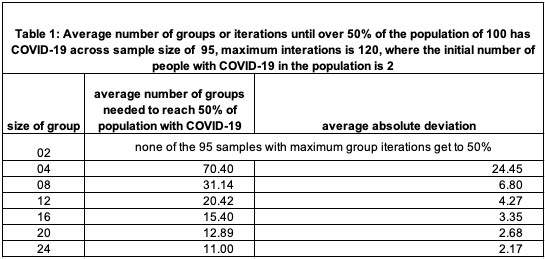
Our summary measure is the average number of groups needed to exceed 50 for the group size evaluated. Table 1 has this information for group sizes 2, 4, 8, 12, 16, 20, 24. Group size 2 does not get to 50 within 120 groups. The average number of groups to get to 50 drops dramatically as the group size increases. Figure 3 illustrates this declining rate.
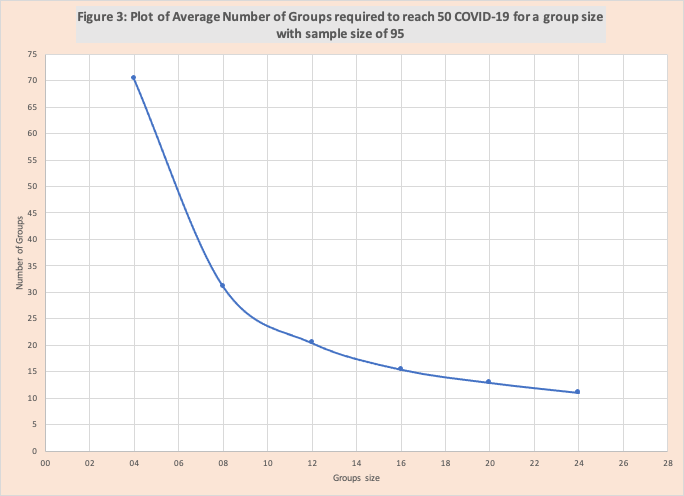
This clearly illustrates the value of small group sizes to limit COVID-19 spread.
Step 4 Would extend the model to capture additional complexity and create a larger number of samples.
Conclusion
In developing COVID-19 policies and managing supply chains the constant drumbeat is “data-driven decisions” where the new high priests are data scientists. The key to success is operations management and data by itself is not sufficient. The missing critical success factor is “models” to project the impact of decisions and identify where “reliance inflection points” are located in the data. This blog has illustrated that a simple model that can be written in a few hours provides more insight than is possible with just data.
Enjoyed this post? Subscribe or follow Arkieva on Linkedin, Twitter, and Facebook for blog updates.