Strategic Benchmarking in the Supply Chain Triangle (Part 2)
Is it possible to use a company's public financial data to strategically benchmark inventory? Bram answers this in the two part conclusion to his 'Inventory Benchmarking’ blog series.
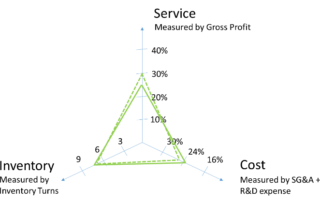
Is it possible to use a company's public financial data to strategically benchmark inventory? Bram answers this in the two part conclusion to his 'Inventory Benchmarking’ blog series.

The day is nearing where the next CEO will be a former VP of Supply Chain. Continue to develop your skills and you will become a great fit for that position in the future.
Sometimes companies implement a forecasting system but do not realize the anticipated gains in the forecast accuracy. Very often, it is not the actual software but the setup that is to be blamed. And I do not mean the setup at the technical (parameter level) but more the process level. Read this blog post on how to get the setup right.

Supply Chain Planning deals with the future and therefore uncertainty with economy. As a result, the planners sometimes have to question other people’s assumptions. Whether for this or some other reason, they do not get credit that is due to them for the great job they do. Eric Wilson from Tempur Sealy gives them the due credit and then some and calls them the super heroes of business. We agree!

Are the researchers in the academic world aligned with the expectations and needs of the business world when it comes to the world of forecasting? Or are the two very different? What can the academe do that will be of value to the business folks? Read on to see some of my thoughts on this topic.

Have you ever wondered whether you should forecast: Bottom-up? Top-down? Middle-Out? It turns many in the demand planning profession do. Read along to see why you can do all of that and more with attribute based demand planning.
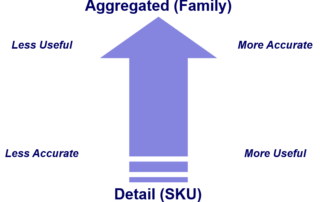
Should one forecast at the SKU-Customer-Location level and aggregate the results up? Or should one forecast at the product-family-region level and dis-aggregate the results down? Or should one do both and try to triangulate the results? Which method gives the best results to the business? Let us look at this together.
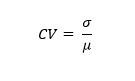
In one of my previous posts, I wrote about using coefficient of variation (CV) as a predictor of forecastability. In this post, I will talk about how it can be used to indicate a sensitivity of lead time towards the safety stock calculations. To quickly remind the reader first: The formula for CV = StdDev
Key Point: Coefficient of Variation is not a perfect measure of forecastability. However, if used properly, it can add value to a business’s forecasting process. In the world of forecasting, one of the key questions to consider is the forecastability of a particular set of data. For example, a salesman might consistently be better at
You have a favorite forecast accuracy metric(s) you’ve been practicing within the organization for a while, and now you think you are ready to bring it to the Sales and Operations Planning (S&OP) meeting as a Key Performance Indicator (KPI) of your demand planning process. But you are not sure exactly how to go about