Summary
An ongoing challenge for any firm is estimating demand for new products. This is especially true when the product has new technology or is replacing an existing product and the additional function in the new product is limited. Often a mathematical construction called an S curve is helpful. An S curve has four stages, initial slow growth, rapid growth, late-stage slow growth, and no growth or loss in demand (called stationary demand). This blog provides an overview of S curves and why they can be helpful. It closes describing a piece-wise linear S curve that Arkieva has found particularly helpful and supports the concept of community intelligence.
Introduction
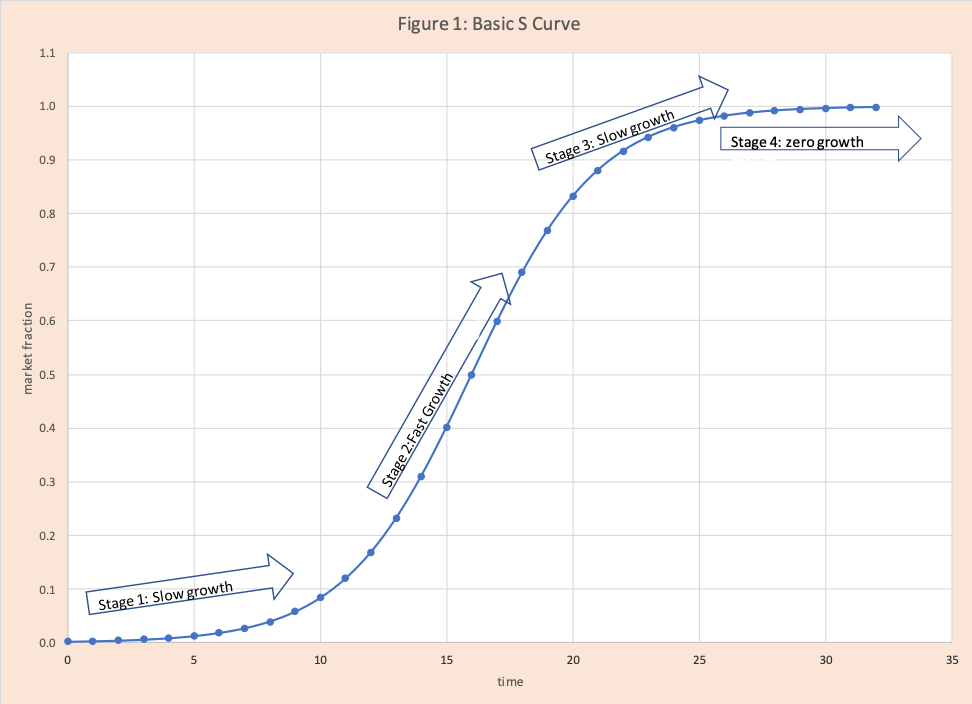
Estimating the demand for new products is a challenging exercise for any firm. This is especially true when the new product has new technology. One such example is the transition of cell phones or personal devices with keyboards (Blackberry) to just screens (iPhone). Another challenging situation is when the new product is just a limited upgrade in function like a cellphone upgraded with a bigger screen, better camera, or more memory. Often the “S Curve” (figure 1) is a helpful computational method for organizing your analysis. They are very helpful for other areas such as recovery from a medical issue, project management, learning curves, chemistry, and technology transitions; like payphones to cell phones.
S curves are named based on their shape. They have four stages:
- Stage 1 slope is small: in terms of new product introduction, slow growth of market share.
- Stage 2 slope is large: fast growth in market share, business takes off.
- Stage 3 slope is small: slow growth to zero growth.
- Stage 4 slope is zero: no growth in market share.
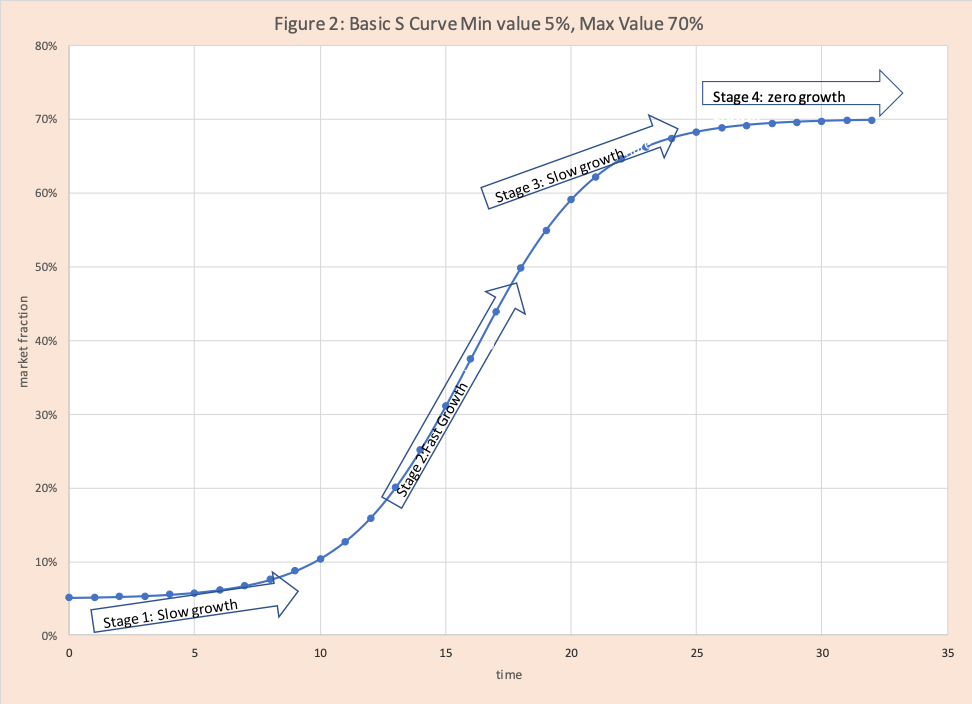
Observe figure 1 has a lower bound of zero and upper bound of 1 which is typical for a basic S curve formula. It is easy to rescale to a lower bound and upper bound that maps into your business assessment. For example, figure 2 incorporates the assumption when the product is initially launched it has a 5% market share and the maximum market share is 70%. Note the shape of the two curves is identical.
S Curve Logistics Equation
There are a number of equations that can generate an S curve, the most common is logistics function with the equation (in Excel notation):
- S(x) = (1/(1+exp(-kx))^a is the simple form of the equation, where the minimum value is 0 and the maximum value is 1, k and a both >0 and control the shape.
- S(x) =min+ (max-min) * {(1 /(1+exp(-k(x-x0)))^a} is the formula I use, where
-
- min is the minimum market share at the start of production introduction (in figure 02 min is 5%)
- max is the maximum market share for the production (in figure 02 max is 70%)
- when the min is zero and the max is 1, the curve ranges from 0 to 1
- the curve shape remains the same independent of the min and max
- exp is exponent, in the formula used the Excel function notation for exponential
- x is time buckets, for our example, the range runs from 0 to 32
- x0 is the mean of the time buckets (for this example it is 16
- k is a parameter that controls the shape of the curve, k>0, the larger the value, the later start into fast growth, and steeper (large the slope) the growth
- ^ is the excel symbol for “to the power”
- a is a parameter that controls the shape of the curve, a>0, lower the value, sooner to start fast growth, less steep fast growth
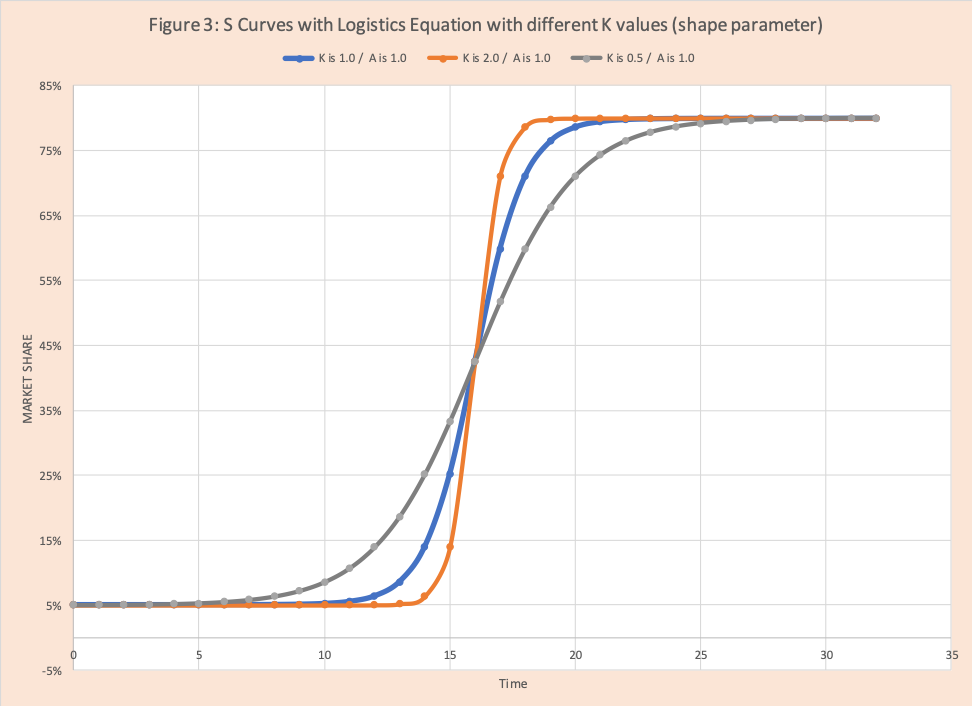
Figure 3 shows different S curves using the logistics function for different values of k and a fixed to 1. The blue line has k=1 and serves as the baseline. When k=2, fast-growth starts later but increases quickly. When k=0.5, fast-growth starts earlier, but the increase is slower.
Other “S” Curve Equations:
There are several equations that generate an s curve, two common ones are
Option 2: f(y) =min+(max_min)*[.5+.5*{ (exp(y)-exp(-y))/(exp(y) + exp(-y))}],
- Option 3: f(y) =min+(max_min)*[0.5+0.5*{ y/((1+y^2)^0.5)}],
- where y = k(x-x0)
- k is the shape parameter
- x is time buckets
- x0 is the mean of the time buckets
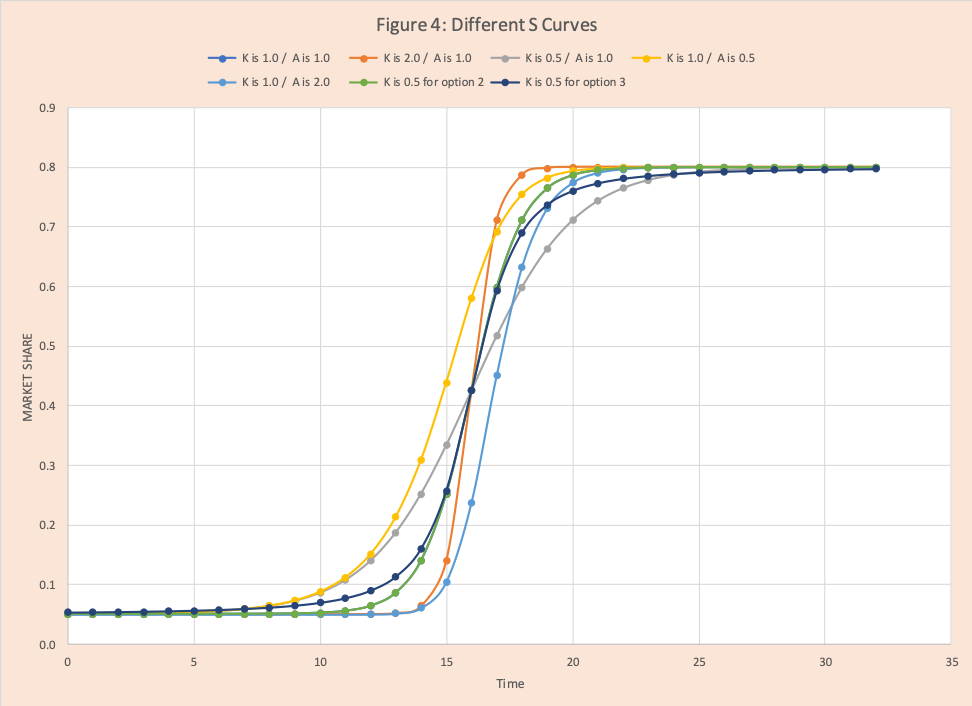
Figure 4 shows various S curves for different “k & a” combinations for the logistics curve and one curve each for option 2 and option 3.
How does this help with the estimated market share (demand) for new products?
- Understanding based on historical experience showing that new products often (but not always) follow this curve helps set the discussion and expectation of product launch and ramping up manufacturing.
- As the product rolls out and actuals demand (orders) arrive it provides a method to track actuals to a projection so the firm can be responsive. For example, if you aren’t expecting an uptick in demand around time bucket 12, but you see an increase in time bucket 10, that can be a sign that demand will grow quickly.
Which S curve works best?
Typically, one looks for other products that you believe are similar and that you have data for. Based on this data you select a curve that does a decent job of fitting the data you have. There are formal statistical methods to find the “best fit” and assess how well it fits. An example of such a method is minimizing the error sum of squares for finding the best fit straight line.
Piece-Wise Linear S Curve
However, the use of a smooth curve to estimate response dates back before easy computational methods, I have found the use of a piece-wise linear curve more intuitive and very valuable. Figure 5 has an example of this curve. There are four connected line segments that match the four stages of growth presented in Figure 1. We have simply replaced the “curve” for each stage with a straight-line segment. This enables us to build the graph simply by specifying the values in the input table found in Table 1.
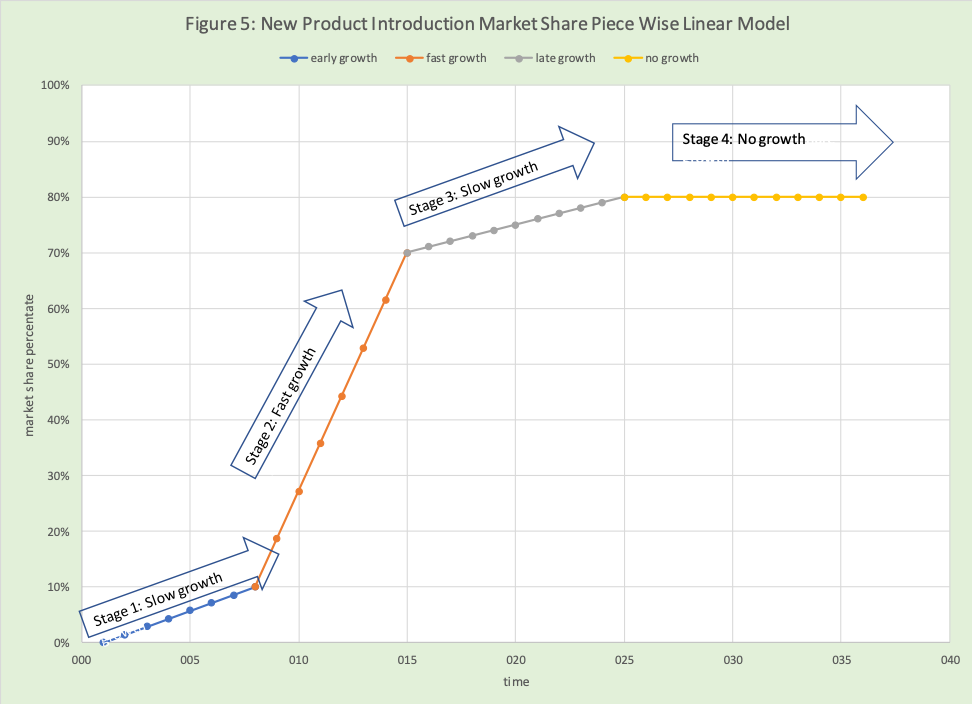

The inputs are divided into two groups: time and growth.
Time Input
- Start time is the first time period or bucket for the planning period. This is the start of stage 1.
- Time bucket starts fast growth, is the end time for stage 1 and the start time for stage 2.
- Time bucket end fast growth is the end time for stage 2 and the start time for stage 3.
- Time bucket end of market share growth is the end time for stage 3 and start time for stage 4.
- Time bucket end of the planning horizon is the end time for stage 4.
Growth inputs
- Minimum market share is the market share at the start of stage 1.
- Market share at the start of fast growth is the market share at the end stage 1 and start stage 2.
- Market share at end of fast growth is the market share at the end stage 2 and start stage 3.
- Maximum market share is market share at the end of stage 3, start and end of stage 4.
The user specifies these based on the experience with other products and market intelligence. Simply using some basic algebra and excel functions, the graph is produced.
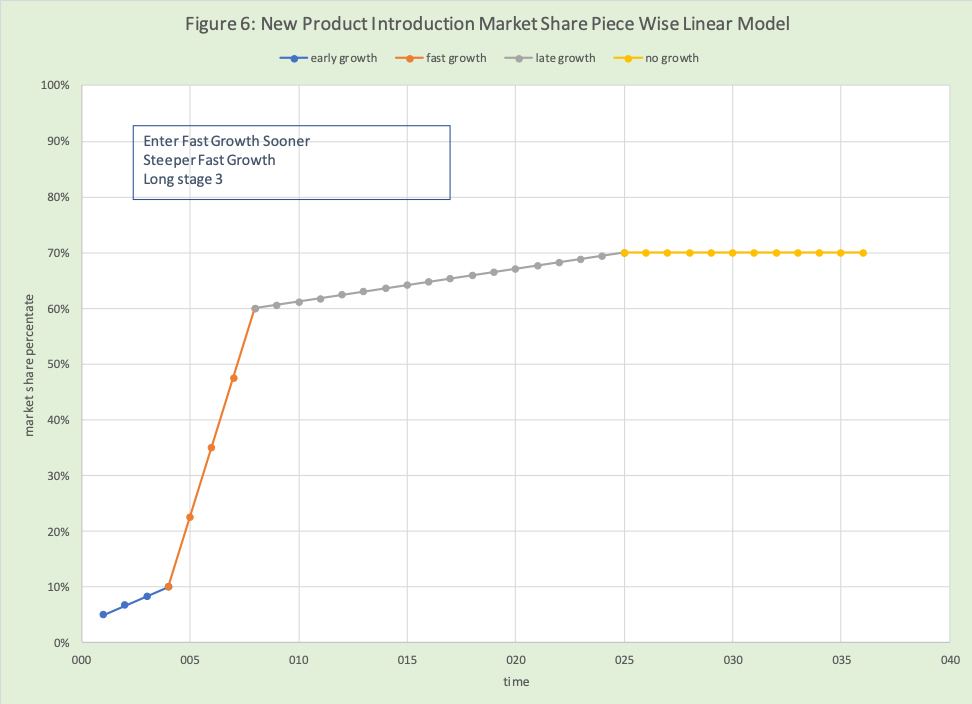
Table 2 and Figure 6 show another market share growth curve where the start of fast growth occurs sooner and is steeper.

Fitting a Piece Linear Model to a set of data
What if we have a set of market share data for a product and what to “best fit” a piece-wise model. Can this be done? Yes, the method joinpoint regression will do this.
Conclusion
S curves can be particularly helpful as the firm looks to best understand the introduction of a new product and its impact on demand, supply, and finances. There are a number of mathematical equations that will generate S curves with different shapes – where shape relates to when the four stages of market growth (start and slow growth, fast growth, slow growth again, no growth) start, end, and their steepness. I have found the linear piecewise particularly helpful and supports the concept of community intelligence.
Webinar Replay: Using What-If Scenarios to Improve Forecasts for New Products – Lessons Learned from the Popeye’s Chicken Sandwich Shortage
Enjoyed this post? Subscribe or follow Arkieva on Linkedin, Twitter, and Facebook for blog updates.