One question that I often get is about setting a proper target for forecast accuracy for a company. This is often framed by practitioners in the following way: ‘My management team is challenging me to get the forecast accuracy higher. I just do not know how to set their expectations as to what the maximum achievable accuracy is given our business conditions.’ Let us attempt to address this question in this blog.
In this blog, we will avoid a discussion on what is a good forecast error metric and simply assume the one that is very commonly used: Mean Absolute Percent Error (MAPE).
Comparing to Other Companies
One obvious approach is to use a benchmarking survey or other published data. On any given day, it is possible to Google forecast accuracy data for many companies as reported in surveys, articles, and such. IBF publishes an annual survey of forecast accuracy data across industries. The problem with this approach is companies measure forecast accuracy differently and the data is generally not usable except at too high a level. This point was made very well in this article a few years ago.
Comparing to the Past
The other obvious approach is to compare to the past forecast accuracy data for the company in question. However, it is probably safe to say that some amount of dissatisfaction with the historical forecast accuracy led to the question in the first place. Hence, this approach is also not promising.
Our Approach
Our approach to target forecast accuracy is based on the idea that for a given data set, only so much accuracy is possible given a particular formula of measuring forecast accuracy. An analogy I like to use is this: Given a particular fruit, there is a limit on how much juice one can extract from it. Buying a more powerful extractor can help, but only up to a certain point. Other people describe this as signal versus noise.
With the above in mind, the first step in calculating a meaningful forecast accuracy target is to understand the level at which one would measure the forecast accuracy. That can be a whole discussion. For now, let us assume we are interested in forecast accuracy at the material-location level.
The first step is to run a segmentation analysis to understand what parts of data should be forecasted in which way. This was covered very well by Ken in his blog post, “Time Series Forecasting Basics“.
The next step is to forecast using a simple method. We recommend the following 3.
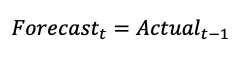
For relatively stable items, the forecast in this period equals the actual sale of the previous period. This method is also called the random walk method.
For seasonal items, the forecast in this period equals the actual sale of the same period last year. This method is also called the seasonal random walk method. In a monthly setup, this would look as follows. In a weekly setup, it would similarly be t-52.
![]()
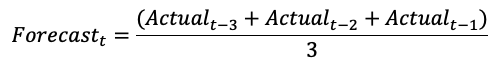
For all others, one could simply use a 3-period average as the simple method.
All these methods are simple enough to be coded in Excel. Also, most if not all forecasting packages have these methods.
To be clear, at this point, your data set would be divided into three subsets where you would be applying one out of the three different simple methods mentioned above. So, if one has 100 combinations, 27 combinations might be forecasted using the random walk, 33 using the seasonal random walk, and the remaining 40 using the 3-period average.
The next step is to calculate the forecast accuracy achieved from these simple methods. Say it is x%. Now you have the lower bound or the minimum accuracy you should be able to achieve in your data set. As these methods are so easy, they can be programmed in MS Excel.
The next question is this: By deploying a sophisticated forecasting package and process, how much can one increase the forecast accuracy by? Past research has shown that improving accuracy from the simple methods is not an easy task. When done well, 6-12% improvement in accuracy above the simple methods has been observed.
Now, one must apply this to their own situation. One could think along the following lines to pick a number from that range.
- If forecast accuracy from the simple method is very low (<25%), the bump from a sophisticated forecasting package and process might be limited.
- Likely reason: Data set is fundamentally unforecastable (too much noise).
- If forecast accuracy from the simple method is very high (>85%), the bump from a sophisticated forecasting package and process might be limited.
- Likely reason: Data set is so predictable; the simple methods are already able to extract almost all ‘signal’.
- If the company in question is relatively immature in the forecasting process, they might take a long time to improve. This will limit their short-term upside in the forecasting accuracy.
So, there you have it. Our approach of setting meaningful forecast accuracy targets. If you have done this differently, please share. If you would like to discuss this further, please contact us.
Enjoyed this post? Subscribe or follow Arkieva on Linkedin, Twitter, and Facebook for blog updates.