Summary:
A common question is how to best manage safety stock for critical raw materials that are critical to the production of the exit product for a firm’s supply chain, often followed by can we use traditional methods for stock calculations for exit products (often referred to as finished goods). Yes, traditional methods can be adapted for critical raw materials. However, it is not uncommon to find methods quasi-specific to raw materials used in industry with reasonable effectiveness, although the fundamentals of inventory management remain the same.
In both cases handling the variability in consumption and replenishment represent the cornerstone of both approaches. “Material” characteristics such as shelf life, storage, and lot sizing must be accounted for in the solution. Separate “excursions” from the norm that generates supply interruptions must be thought through. Typically, community intelligence is very helpful in closing prediction gaps.
Introduction:
A question that often arises is how best to manage safety stock for raw materials and is this different than safety stock for exit products. The effective management of critical raw materials is a dominant concern in a wide range of industries such as, but not limited to, micro-electronic devices (MD, your cell phone, computer, car), mining, cheese, chemicals/plastics, drainage pipes, pharmaceuticals, and coffee. The purpose of this blog is to sketch out the big picture and various approaches, not specific computational methods.
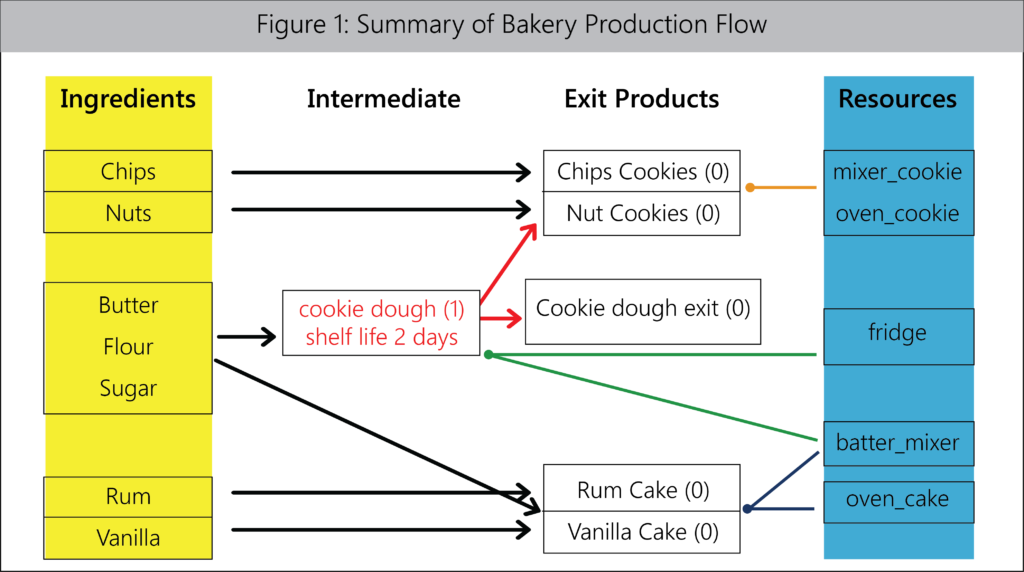
First, let’s establish some common definitions for the production and distribution flow from raw material to meeting exit demand aka your supply chain. I am a strong advocate of Dr. Karl Kempf’s view the “chain” is best seen as a demand-supply network (DSN). Let’s use the bakery example in Figure 1. The basic players and relationships are:
- Bottom dwellers – purchased products (ingredients): chips, nuts, milk, butter, flour, sugar, rum, and vanilla. These are the raw material for this DSN. Typical features and characteristics of interest/concern are storage available (milk and butter require refrigeration), “lot-sized delivery” (flour only comes in 100 lbs. bags), shelf-life (milk)
- Top dwellers – only exit products: Cookies (Chip and Nut) and cakes (Rum and Vanilla).
- Middle dwellers – in this example the only intermediate product is cookie dough which is a component product and an exit product.
- Resources – mixers, ovens, fridge.
- Bill of Material – basics on how a product is made: ingredients, resources, process time, yield
- Cookies consume dough, chips, nuts, mixer_cookie, oven_cookie
- Cakes: consume vanilla, rum, flour, butter, milk, sugar, batter mixer oven_cake
- Dough consumes flour, butter, milk sugar, batter mixer, fridge; cycle time 1 fully day, the shelf life of 2, shares capacity with Cakes
- “The great 20th-century revelation that complex systems can be generated by the relationships among simple components” applies to supply chain planning (and almost all aspects of planning, scheduling, and dispatch).
Safety Stock Raw Material Basics.
As with all safety stock, the goal is mitigating risk as inexpensively as possible. For raw material, the purpose is generally viewed as ensuring production is not substantively impacted by the lack of critical component material. Yes, the “ultimate goal” is to ensure all demand is met in time, but typically “avoiding” interrupting production is seen as an effective and practical substitute that is more realistic in managing DSN where decisions are loosely coupled.
Starting Place:
A “point” estimate of how much critical raw material will be needed when?
- “Good practice” is to use any best in class central or supply planning engine (CPE) that takes in the exit demand, the details of the DSN, existing supplies of raw material, and one output of the solution is a reasonably detailed “point estimate” of how much raw material will be consumed when.
- In the bakery example, this might be the flour required across the planning horizon. “Point” refers to a single value per time bucket that represents consumption. “Best” CPEs can accommodate purchases that need to be made in lot-sized quantities.
- Other approaches. In the prior bullet, I put good in quotes and intentionally did not use “best”! From time in the trenches I have seen (and written) some pretty decent estimates of raw material need based on aggregate estimates of what the production facility will make matched with demand in some aggregate form (microelectronic devices technology, pharmaceuticals active agent) and a one-step BOM (bill of material) that links consumption of critical raw material to this estimated production. One warning, once this gets institutionalized it is often not adjusted to changes in the DSN and down the road, a poor estimate is provided.
Uncertainty.
Alas, the work of the planner would be so much easier if there was no uncertainty in the need (amount and when) for the raw material and the ability to have supply replenished.
- “Good practice” would be to identify the exit demand supported by the raw material, estimate an aggregate uncertainty on this demand, and use this as a measure of the uncertainty on the demand (need) for the raw material. In traditional safety stock calculations for exit demand (top dwellers), this is either the demand variability or the forecast variability. The second component of “good practice” is to assess the variability in the ability of the supplier to replenish as needed. This is the typical lead time. Once these estimates are in place traditional safety stock calculations can be made and provide insight helpful to the safety stock decision.
- Again, I have used “good practice”, not “best practice”. I have seen and written specialized safety stock models where aggregate levels of consumption of the raw material are determined from point estimates of consumption, the variability is estimated based on production history (and when intelligently done linked back to the type of production), replenishment time variability is based on history and commitments from the supplier. Some advantages of this approach are it is easier to account for storage limits and “lot-sizing” of the arriving raw material. It is also easier to formulate a small simulation model to assess risk.
- The two methods are not mutually exclusive, and all roads lead back to the CPE and a clear statement of risk.
Supplier interruptions or Manufacturing excursion
The big bumps in the road. Both are real and must be dealt with as much with strategic and tactical discussions supported with models to provide insight and a financial assessment of cost versus risk. They are not typically handled with basic safety stock calculations.
Read More: Coronavirus a Substantial Supply Chain Interruption
Data-Driven Intelligence versus Community Intelligence
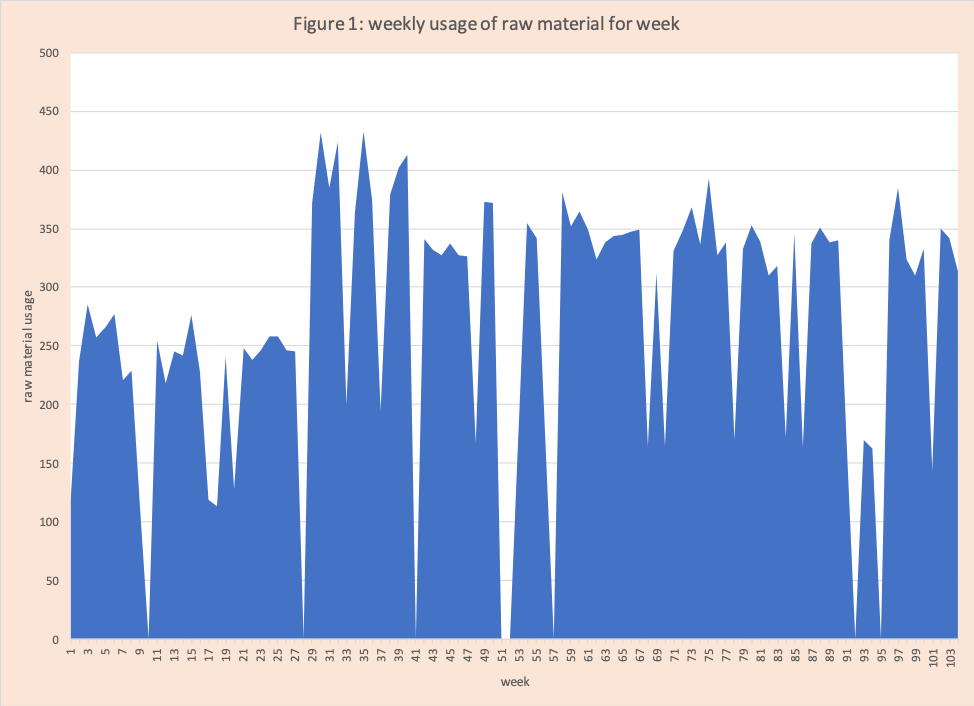
We will finish with an example to demonstrate the limits of data-driven intelligence versus community intelligence. Assume the only immediate data available is two years of history of the weekly usage of the raw material in weekly buckets. Figure 1 has a graph of usage. Table 1 has the basic statistics profile for this data set. A quick visual inspection shows
- some intermittent zero or significantly low values (compared to the adjacent time periods)
- a jump step up around week 28
- a reasonable amount of variation from week to week
Table 1 tells us the average weekly usage over two years is 268.3 with a standard deviation of 111.63 and maximum usage of 433.
It is important to note as much as a visual characterization by a trained eye can be helpful, it is impractical for industrial use. At Arkieva, we have an ever-growing set of AI routines that characterize a data set that is part of the demand management with a history going back to the 1980s under the leadership of Dr. Degbotse.
Assume for simplicity the lead time for delivery of an additional supply of raw material is a fixed 3 full weeks. If I place a replenishment order at the start of week 5, it is available for the start of week 9. The capacity available to hold the raw material is 1500 units. How do we determine how much to reorder when? What would be most helpful is an accurate prediction of usage for the next 3 weeks. How we get one?
- With data-driven intelligence, we would the best statistical forecasting and machine learning algorithms available to help “understand” the patterns and get the best in class prediction. However even the most advance methods are going to struggle with the low values and the jump step.
- With community intelligence, we would chat with the factory folks and folks building the CPE and find out the following
- The low values occur when one of two items happen
- There is a product mix changeover when this happens production is shut down for a week. In history, this occurred between weeks 27 and 28 generating an average usage change from 200 to 350. It also occurred between weeks 40 and 41 generating an average usage change from 350 to 300
- There is a manufacturing excursion that shuts down production for the week or part of the week
- Some of the week to week variations represent temporary changes in product mix starts based on the available raw material. When stocks are high, the products which use more raw material get priority to be started. When stocks are low the reverse is done.
- The low values occur when one of two items happen
Typically, this type of data is not stored in any central ERP system, but it is kept local to manufacturing. Any factory capacity model and a good CPE modeler will know to look for this.

Enjoyed this post? Subscribe or follow Arkieva on Linkedin, Twitter, and Facebook for blog updates.