In an ideal world, demand and supply would be steady and predictable, resulting in optimal capacity utilization and no back orders or missed customer orders. However, in the actual supply chain world variations in actual sales vs. projected sales result in lower forecast accuracy, and either overstocking or stock out situations.
How can we improve demand forecast accuracy and keep the right inventory levels?
The answer lies in the detailed analysis of your demand sales pattern coupled with proactive adjustments in planning.
Related: How to Report Forecast Accuracy to Management
6 Demand Sales Pattern Trends to Analyze
Daily entry and recording of customer orders in the ERP system is the foundation of sales pattern analysis. Initially, a smaller time range and fewer customer orders may provide limited or skewed data. However, once substantial data is recorded in the system, it provides recurring patterns and interesting revelations of the sales trend. Below are a few examples of demand sales pattern trends.
1. Demand spreads throughout the month
When customer demand is spread throughout the month, we can consider such demand as relatively steady demand. Such demand results in better capacity utilization and predictable production and dispatch throughout the month (refer below image).
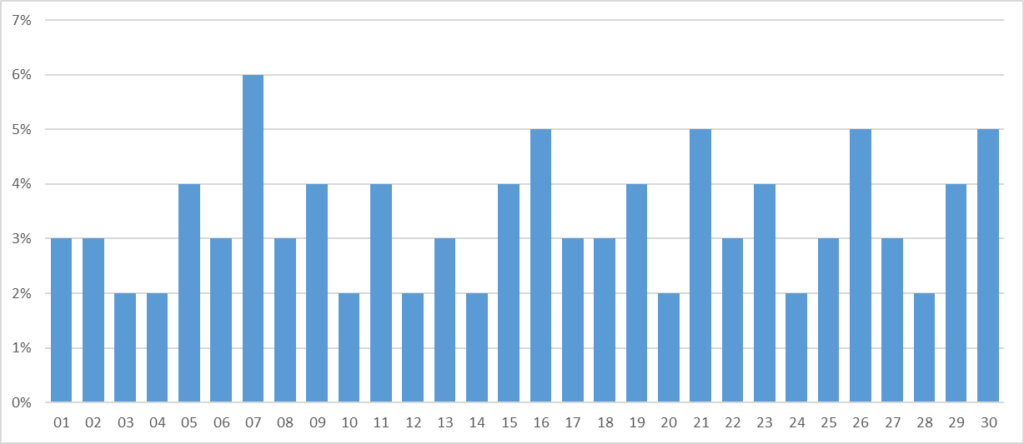
Probable actions: Determine and apply a reliable predictor ratio for planning purposes. Predictor ratio is the ratio of the actual total shipments of M1 (next month) and the open orders of M1 as of a particular date in M0 (current month).
2. Demand only during the weekdays
Such a scenario applies to companies working on a five-day schedule. Here, the weekly customer demand is compressed into five days; additionally, each week of the month can have a different sales pattern (refer below image).
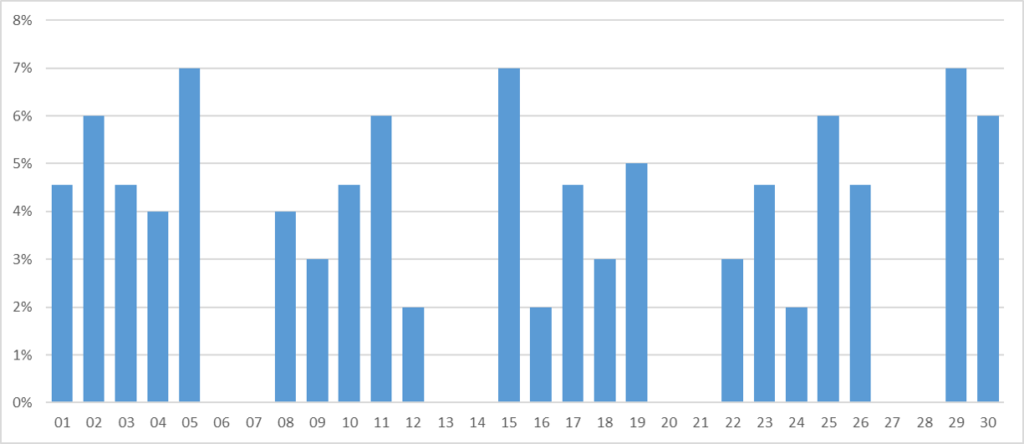
Probable actions: Refer to the historical daily customer demand during the same period/season. Based on the current open orders and historical sales trend, balance and allocate manufacturing, packaging, and distribution resources.
3. Demand front-loaded in the month
When the majority or all of the customer demand comes in the early part of the month, it’s known as front-loaded demand. Some companies which cater to recurring monthly customer purchases, tend to front-load their demand on their suppliers. Front-loaded demand requires advance estimation and planning of manufacturing and distribution activities to service the peak customer orders at the start of the month (refer below image).
[Read more: Comparing the Accuracy of 4 Different Demand Forecasting Methods]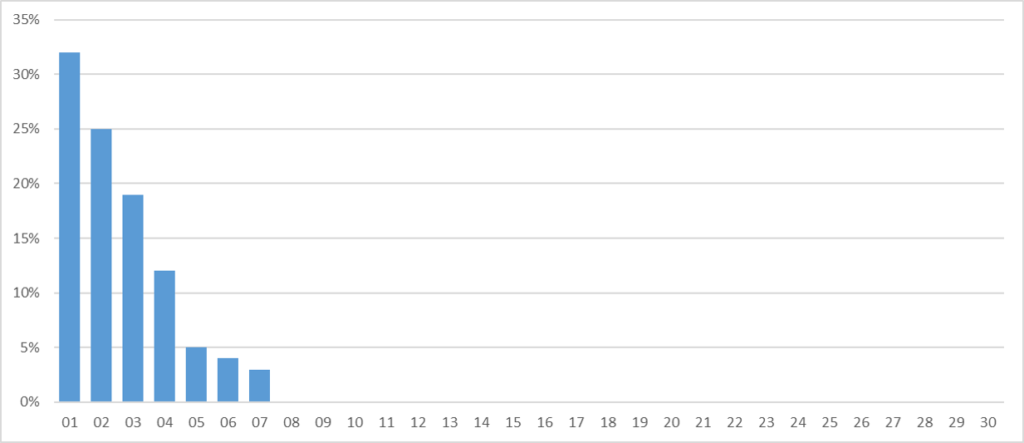
4. Demand back-loaded in the month
When customer demand comes in the later part of the month, it’s known as back-loaded demand. Some companies provide monthly sales incentives to boost sales in the later part of the month, which drives back-loaded demand generation. Similar to front-loaded demand, manufacturing and distribution activities need to be adjusted accordingly to cater to the huge flow of customer orders towards the end of the month (refer below image).
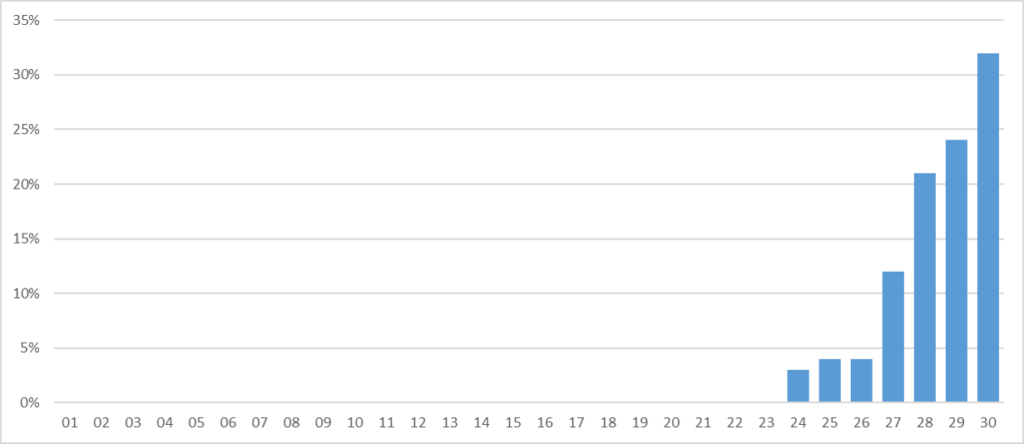
Probable actions for Front-loaded & back-loaded demand: Refer to the historical monthly customer demand during the same period/season. Judiciously apply make-to-stock manufacturing strategy during the lean order period of the month and allocate more resources to packaging and distribution during peak customer order period of the month.
5. Demand middle-loaded in the month
When the majority of the customer orders come in the middle of the month, it’s known as middle-loaded demand (refer below image). Such a pattern can be a bit tricky to handle since the points at which the demand picks up and tapers down cannot be reliably predicted (unlike front-loaded and back-loaded demand).
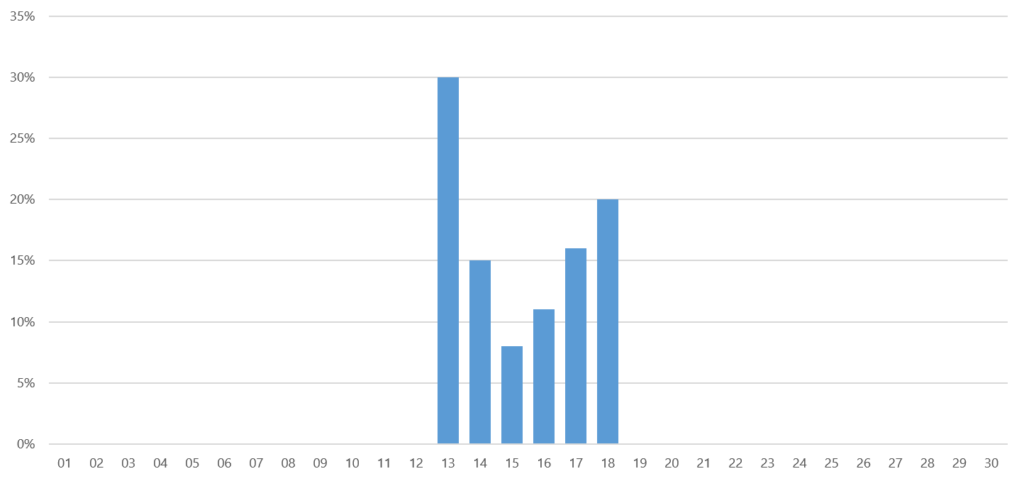
Probable actions: Refers to the historical daily customer demand during the same period/season. Allocate more resources to manufacturing during the early and later part of the month and divert more resources to packaging and distribution during the middle of the month.
6. Varying demand pattern within a week
Certain businesses like restaurants, hotels, entertainment, etc. have a varying demand throughout the week (refer below image). There is more demand towards the end of the week and less demand in the early part of the week. Meticulous planning is required in such scenarios since the capacities are strained during the peak periods with little or no flexibility of temporary capacity enhancement.
[Read more: 6 Ways You Can Improve Forecast Accuracy with Demand Sensing]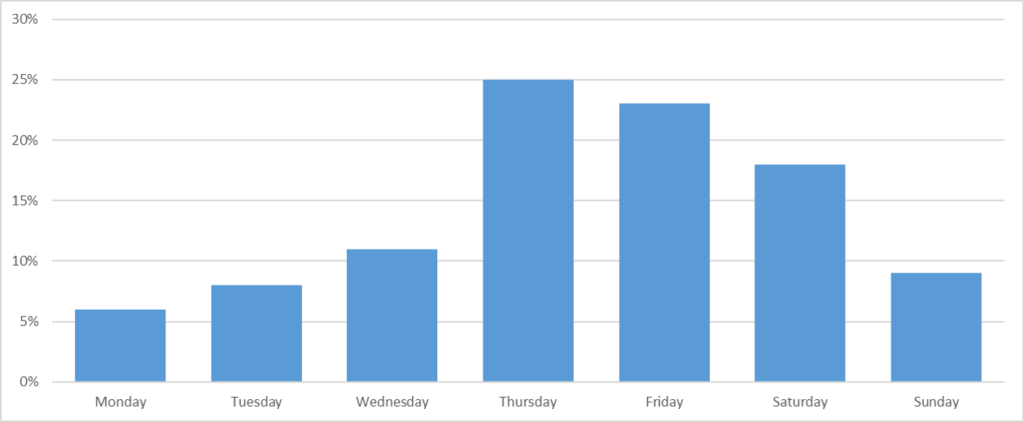
Probable actions: Flexible manufacturing system is best applied to such scenarios. During the lean customer order days, allocate more resources to preparatory work like sub-assembly, pre-packaging, etc. And during the peak customer order days, more resources need to be allocated to manufacturing, packaging, and distribution.
Sales pattern analysis requires historical sales data, tracking of current sales forecast and demand sensing. External factors and industry trends and drivers also need to be taken into consideration.


