In the simplest inventory situation, the only variability is in the quantity of demand for a single day. There is no trend up or down or seasonal effect. The demand today is independent of the demand for tomorrow. Additionally, we will assume replenishment time is zero. That is when we place an order for additional material it arrives immediately – sort of like we have a Star Trek transporter. However, we can only reorder every N days, where N might be 3, 4, 20, etc.
To calculate the safety stock required using the normal distribution, we need the following information.
- Mean or average daily demand (M)
- The standard deviation (average variation) of daily demand (S)
- The number of days between reordering (N)
- The desired fill rate (F) – which is the probability all demand is met over N days is met from material in stock. In statistics this is the probability of success. Note failure, some demand occurs we cannot meet from inventory is called back order rate.
In this situation, safety stock is the amount of inventory we keep on hand above the average demand. Note the high the safety stock, the higher the probability of success (fill rate) and the lower the probability of failure (backorder rate).
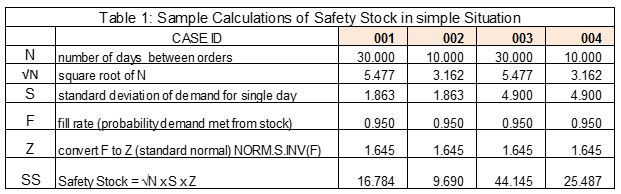
“Assuming the normal distribution” (we will address this assumption in moment), the equation for safety stock is SS = Square root(N) x S x NORM.S.INV(F), where SS is safety stock, N is the number of days between reordering, S is standard deviation of daily demand, F is fill rate, and NORM.S.INV is the excel function to convert the failure rate to a “Z” value (which is the standard normal value, for example when F is 0.95, Z is 1.64). Observe the average daily demand is NOT part of this equation. Table 1 shows some sample calculations.
Within the inventory planning community, a hot topic is “can we really use the normal distribution” – that is can we assume the daily demand is normally distributed!
That is the WRONG Question. Tucked away in that “theory” some of my students and many consultants find an “inconvenient complexity” is the following.
- Our concern is the distribution of total demand over N days, not daily demand
- The expected total demand (average total demand) over N days is N x average daily demand
- The standard deviation of the distribution of total demand for N days is the square root of N times the standard deviation of the distribution of demand for a single day
- For N sufficiently large (how large is discussed in a moment), the distribution of total demand is Normal, independent of the distribution of daily demand from the central limit theorem (CLT). If the daily demand across the N days is independent and identically distributed
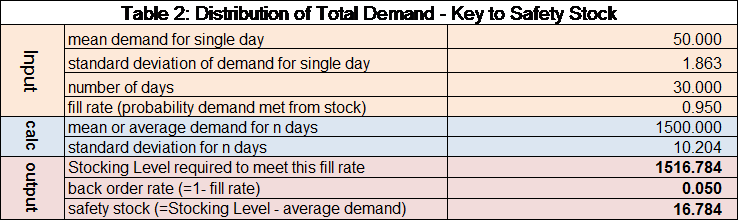
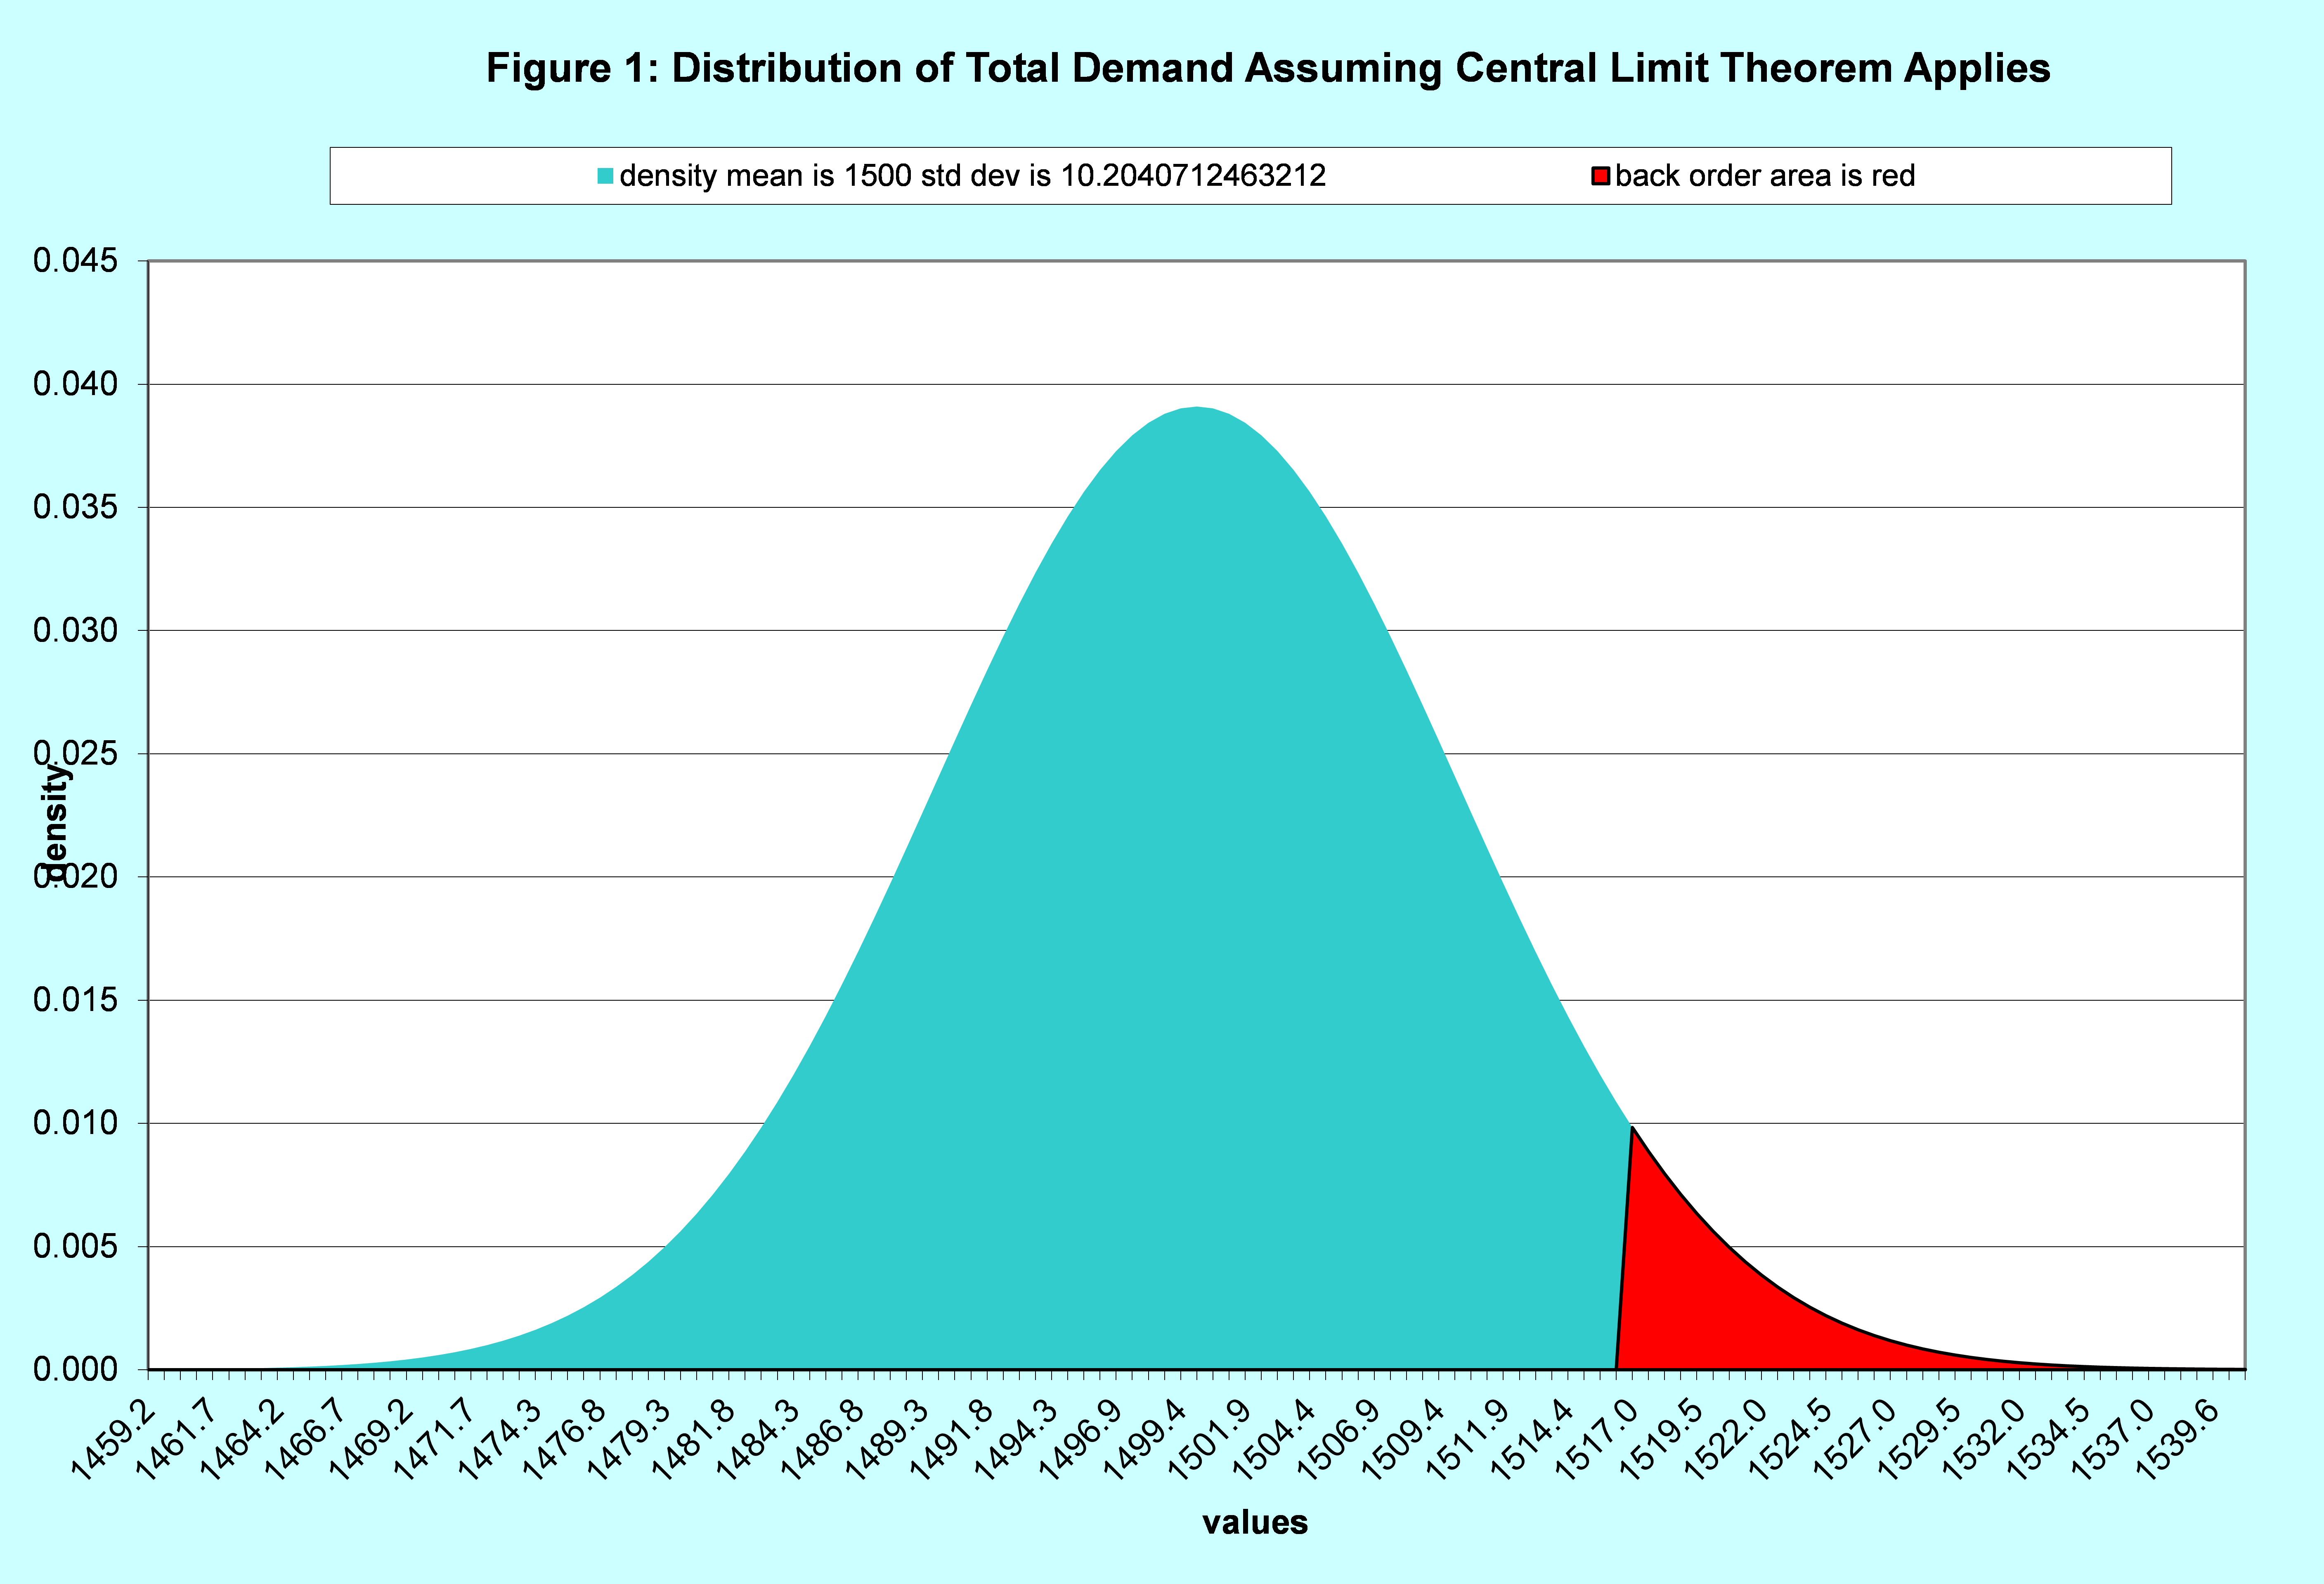
The safety stock equation is simply an EXTRACT of the larger and more informative question of the distribution of total demand over N days. Let’s look at case 1 and assume the average daily demand is 50. This means the expected total demand for 30 days (average total) is 1500 (=30 x 50). Table 2 and Figure 1 have the distribution of total demand for 30 days and identifies the 95% fill rate assuming N (30) is large enough that the CLT is applicable.
The magic question I left unanswered is how large does N need to be to use the normal as a reasonable approximation of the distribution of total demand over N days? It depends on how “ugly” the daily distribution is, the level of precision required, and what fill rate is desired.
Now you might have heard the magic number “30”. If N is greater than 30, then then assuming the normal distribution is correct – “TILT” – not correct. The value of 30 has to do whether one uses the student T distribution or normal distribution for confidence intervals. That is not relevant to this discussion. Of course it sounds nice and the consultant or software vendor might attempt to use this when you ask them. If so it might be time for a new source of support. Sometimes knowing a bit of theory has real value.
If you would like to learn more about this topic (in layman’s terms) please download the following whitepaper.
Like this blog? Follow us on LinkedIn or Twitter and we will send you notifications on all future blogs.