Should you factor returns in your forecast error calculation? In this article, we’ll use a sample data set, to demonstrate if you should consider returns when calculating your forecast errors.
Recently, a fellow group member asked me on LinkedIn, “How do I calculate forecast error when there are returns? Should this impact the forecast error negatively?
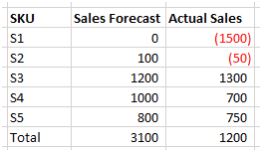
He provided me with the table below as input data.

Figure 1: Sample Sales forecast vs. Actual sales
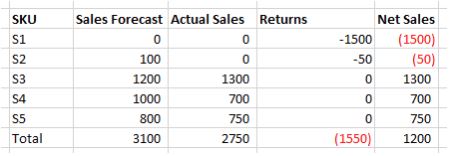
In my mind, I extrapolated this data to have two more columns: Returns and Net Sales. See Figure 2 below. The column Net Sales matches the column Actual Sales from the table above.

Figure 2: Sample Sales forecast vs. Actual sales with returns
Calculating Forecast Errors with or without returns
Now, back to his question: Should return data be factored in the calculation of forecast accuracy. The short answer in most cases is no. This is because we are trying to forecast what the market place needs from us, that is, the sales. Returns, while important, do not take away the fact that we need the inventory to ship to customers who have placed a demand on us.
Now, there are businesses where returns are forecasted. For example, cylinder returns in the propane or LPG business. If so, the forecast accuracy of those returns should be calculated separately from the forecast accuracy of the sale forecast.
Let us look at this in the context of the data provided by the member. Here is the calculation when we use the net sales as the actuals in the forecast error calculation.

Figure 3: Sample absolute error percentage with returns included
[Read More: We Compared the Accuracy of 4 Different Demand Forecasting Methods; Here’s What We Found]
We get an average Mean Absolute Percent Error (MAPE) of 91% and Weighted MAPE of 175%. Very poor accuracy. To learn more about the fundamentals of using MAPE for your forecast accuracy calculations take a look at my previous article on MAPE formula calculations .
However, I would not advise using the returns in the forecast accuracy calculations. When we make that adjustment, the picture improves quite a bit.

Figure 4: Sample absolute error percentage without returns
Ignoring returns, the average MAPE drops to 51% and WMAPE is down to 46%.
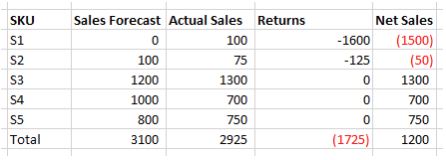
Finally, let us consider the possibility that for SKU S1 and S2, there were sales, which were being offset by very large returns. See below. Please note that Net Sales matches what was provided as Actual sales in the very first table.

Figure 5: Sample scenario with large sales returns
Now that we have seen what happens when we ignore the returns in accuracy calculations, it is only fair to do the calculations using this new data. In the example below, we are using data in Actual sales as the basis for the calculations.

Figure 6: Absolute error calculation ignoring large sales return
[Read More: How Does a Demand Forecast of Zero Impact Your Forecast Accuracy?]
As you can see, the MAPE has now dropped further to 38% and WMAPE has dropped to 20%. Now let us keep in mind that the numbers are specific to the example, and certainly removing returns from the forecast accuracy calculations can have the exact opposite effect. Let us tweak the table above slightly in the returns column to make this point.

Figure 7: Absolute error calculation with smaller number of returns
As you can see, by editing the returns carefully, we were able to drop both MAPE and WMAPE. But this is just math.
Wrapping it up
To summarize, if you are in the business of forecasting sales, then you should ignore the returns when calculating forecast accuracy.
Enjoyed this post? Subscribe or follow Arkieva on Linkedin, Twitter, and Facebook for blog updates.


