In this post, we’ll look at how you can use customer and product ABC segmentation for Inventory management. This type of analysis can help you answer questions such as:
- How does the combination of Product_Customer fit ABC classification?
- How does the combination of Product and Customer ABC segmentation improve inventory management? (Remember, you sell a product to a customer….)
Basics of ABC Segmentation
Let’s review the basics of ABC classification from the APICS Dictionary:
“The classification of a group of items in decreasing order of annual dollar volume (price multiplied by projected volume) or other criteria. This array is then split into three classes: A, B, and C.
- The A class usually represents 10-20% by the number of the items and 50-70% by projected dollar volume.
- The B class usually represents about 20% of the number of items and about 20% of the dollar volume.
- The C class contains 60-70% of the number of items and 10-30% of the dollar volume.
The ABC principle states that effort and money can be saved by applying looser controls to the low-dollar volume class items than to the high-dollar-volume class items. The ABC principle is applicable to inventories, purchasing, and sales.”
As you recognize this as the Pareto principle, you’ll also recognize that 80% of your efforts will come from 20% of the possible causes. How do you make the best use of your time as a Planner to satisfy customers both internal and external?
Read Also: Using Profit-based Product Segmentation for Planning
Creating Your Customer Product Matrix with ABC Segmentation
Step 1: Product ABC
Start with a Pareto analysis of product family subtypes, meaningful to Sales. For example, instead of Mountain bikes, you may want to use the subgroups of: Mens/Womens/Youth or 26er/29er/Hard Tail, or a combination of both. Partner with Sales/Product Manager to show them how it will help them, and they’ll clean this up in a hurry. Use 12-month history and 12-month forecast to compare any differences. Using the rough ABC guidelines above, a good Sales/Product Manager partner will suggest changes to make the analysis more realistic.
Step 2: Customer ABC
Now use a similar approach with customer dollar volume for both history and forecast for comparison. Re-group with your Sales/Product Manager partner and ask for clarification with multiple customer locations or subsidiaries. Remember, you want a realistic grouping, so the number of A customers may spill over 20%, or less than 20% but not significantly so. (Otherwise, everything becomes important increasing constraints until you reach inefficiency.)
Step 3: Create the Product_Customer Matrix
Now construct the Product_Customer Matrix. Use Caps for Customer and decide the ABC code for the resultant intersection.
Example:
Q1. What if you have an “a” Product sold to an “A” Customer?
- Well, that’s obvious, it would be an “A” Product_Customer combination. Likewise, b_B = “B”, and c_C = “C”.
Q2. What if you have an “a” Product sold to a “C” Customer?
- Let’s call that combination a “B”. Or not. Maybe you propose this as a “strawman” and see what your Sales/Product Manager partner says. Do likewise for other combinations.
Q3. What if you have a new Product or a new Customer?
- Label new Products “ua” and new Customers “UA”. This signals an immediate review with Sales/Product Manager.
Read also: Look Beyond the Turnover Ratio!

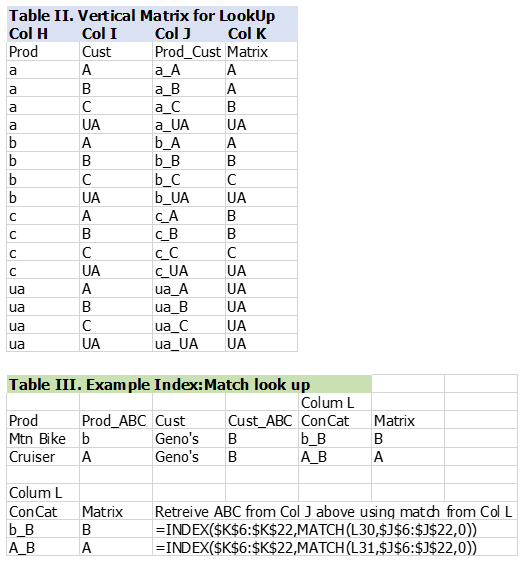
You may want to construct a vertical matrix to assign the ABC code out of the matrix. Use this table to look up resultant ABC codes for Product_Customer combinations for inventory reports.
- Create columns with each code for Product and Customer
- Construct the resultant combination from the matrix, i.e. “b” Product, “C” Customer.
- Concatenate the intersection in another column. i.e. b_C
- Label the resultant ABC code and capture the resultant ABC code indexing on the concatenation.

Practical Applications of How to Use ABC Segmentation to Improve Your Inventory Management
Creating Service Levels for Multiple Customers
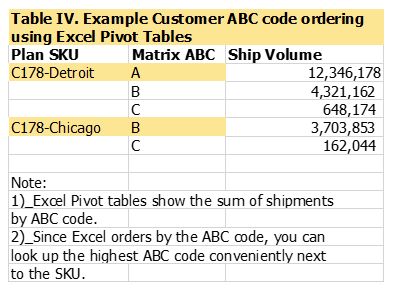
- For every SKU there may be multiple customers. One way to create the ABC Product_Customer classification is to download the customer ship to data with Customer ABC code for each SKU. Using a pivot table or planning tool with segmentation features create the highest-level ABC code next to the SKU. This gives you a Customer ABC code for each SKU, albeit the highest of the list, creating serendipity for lower level Customers (see Table IV below). Another method would be to review each SKU with Sales/Product Manager, but this may be trying their interest in the detail.
Safety Stock Determination
- Product_Customer ABC codes provide guidance to the Planner for determining safety stock. At the SKU level, it’s where you meet the customer, and also the data element for safety stock.
Measure Stock Out Importance
- The Planner also uses these codes in managing inventory to determine the relative importance of stock outs, low inventory levels to serve the customer as well as managing phase-ins and phase-outs.

Read also: Who Should Take Ownership of Finished Product Inventory Management?
Bottom line:
- Partnering with Sales/Product Manager for ABC classification creates buy-in for where the Planner should spend their time in weekly alerts in inventory reports and creating safety stock.
- Using the two-dimensional ABC matrix of Product_Customer provides a meaningful segmentation right where you meet the customer (SKU level).
Enjoyed this post? Subscribe or follow Arkieva on Linkedin, Twitter, and Facebook for blog updates.


