An Approach to Setting Forecast Accuracy Targets
Learn the best approach to setting forecast accuracy targets and how to set expectations for your management team.

Learn the best approach to setting forecast accuracy targets and how to set expectations for your management team.

In a previous blog post, we discussed how a high or low value of Coefficient of Variation (CV) impacts the first or second term of safety stock. Today we decided to put this to the test using real customer data - here we will discuss our findings.
In 1994, the IBM Micro-electronics Division, itself a fortune 100 size firm, put in place a major effort to create best in class supply chain planning process and software including demand planning(DM), central planning, available to promise, et al. I was fortunate to be an original member and had the opportunity to work extensively on
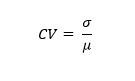
In one of my previous posts, I wrote about using coefficient of variation (CV) as a predictor of forecastability. In this post, I will talk about how it can be used to indicate a sensitivity of lead time towards the safety stock calculations. To quickly remind the reader first: The formula for CV = StdDev
You have a favorite forecast accuracy metric(s) you’ve been practicing within the organization for a while, and now you think you are ready to bring it to the Sales and Operations Planning (S&OP) meeting as a Key Performance Indicator (KPI) of your demand planning process. But you are not sure exactly how to go about

I saw this news article on CNN (here) about our planet’s earth bigger, older cousin. Quite an interesting discovery if you ask me. However, it got me thinking about the family tree of Mean Absolute Forecast Error (MAPE), a subject that I am a little bit familiar with. A few weeks ago, I wrote about
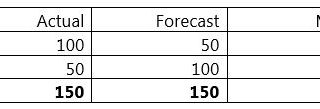
In our line of work at Arkieva, when we ask this question of business folks: What is your forecast accuracy? Depending on who we ask in the same business, we can get a full range of answers from 50% (or lower) to 95% (or higher). How is this possible? Imagine a management team being given

Key Points on MAPE: Mean Absolute Percent Error (MAPE) is a useful measure of forecast accuracy and should be used appropriately. Because of its limitations, one should use it in conjunction with other metrics. While a point value of the metric is good, the focus should be on the trend line to ensure that the

Sales is a fast-paced business; people who aren’t focused on the here and now usually lose out on sales. As mentioned in Jelle’s blog, sales persons would rather be out in the field selling, which is the reason why they feel it would be a waste of their resources sitting in their office forecasting. Yet,
In our last post, Sujit discussed the importance of gathering input from participants as a way to mitigate biases. In this post, I will explain why the sales team should be required participants and what their influence is on the forecasting process.