It is quite common for a supply chain or business leader to ask for a summary version of a performance metric. For example, if a business is stocking 1000 unique product-location combinations, the leaders do not have the time to look at days of supply of inventory on a combination-by-combination basis. Instead, they want it neatly summarized at the global level or at the product family level. And sometimes they want multiple metrics combined to give them a composite number. How to combine very different metrics/KPIs towards a composite score is a question that comes up quite often in my conversations with customers. (NOTE: If you want to skip directly to this, skip to the section titled how to combine two very different metrics)
Let us first look at the concept of finding a mean (or an average or one of the central or summary estimates) of data. There are three main kinds:
Arithmetic mean: This is the most used and is also called average or mean. In fact, mean, mode, and median make up the three most popular summary statistics and are taught in most high school curriculum. I will focus just on the mean (average) here. When quantities are additive, one can simply add the numbers, divide by the count, and report it as the average. Sales, Forecasts, inventory can all be summarized this way. See the example below:

The above is very helpful in cases where the underlying data is additive. But what if the underlying data is multiplicative? Say your business is growing by some percentage each year. What would be the ‘average’ percent growth? Let us look at the table below. Note that the percentage growth in each period is such that we get to the same numbers as the example above. The base where we start from is 100.

If we calculate the average growth percentage as arithmetic mean, we get to 14.00%. Now, if we use the compound interest formula on the numbers:
Final Value = 100*(1+14%)6 = 219
But, as one can see from the table, the actual number at the end of 6 years is 217. In other words, we overestimate our endpoint by about 2 points. (Word to the wise: If we had started from a higher number instead of 100, we would have seen a much bigger difference.)
Learn More: How to Establish Early Warning Supply Chain Metrics
In trying to calculate the summary statistic of this type of number, we get to the Geometric Mean: When the underlying numbers are multiplicative instead of additive, one should calculate the geometric mean by taking the Nth root of the product of all observations.
![]()
NOTE: In this example, we are talking about a percent increase. Therefore, the numbers that go into the formula above will be (100 + given) percentage. Similarly, at the end, one will have to make sure to add the starting sales figure.
Applying this to the example at hand, we get to 13.78%. The final values match (217) if we use the compound interest formula using this Geometric Mean.
Arithmetic mean is very easy to explain and understand. The geometric mean is exactly the opposite. It does not lend itself to an easy physical explanation.
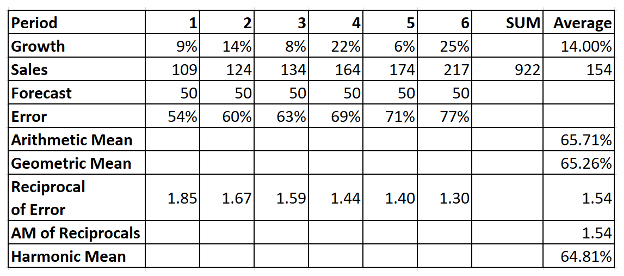
Let us take this example further and add a forecast into the mix. Further, let us calculate a forecast error as a percentage.
![]()
Let us assume that the forecast was a flat 50 units per period. Then, we can see:
- The Arithmetic mean of the errors is 65.71%.
- The Geometric mean of the errors is 65.26%
Unfortunately, both are misleading. One must keep in mind that percent error is a result of division. In division, one must be aware of the denominator. A large denominator will suppress the final value and vice versa.
In trying to calculate the summary statistic of this type of numbers, we get to the Harmonic mean: When the underlying numbers are ratios (or rates or in general divisions), one should calculate the harmonic mean by taking the reciprocal of the Arithmetic mean of the reciprocals (I agree it is a mouthful to say).

The table below summarizes the calculation.

Notes:
- Harmonic mean can be used to summarize margins, production run rates, etc.
- It can also be used to solve grade school problems around average speeds.
- Weighted average is a widely recognized interpretation of harmonic mean.
- Both the harmonic and Geometric mean cannot handle zero values.
All three types of means have their pros and cons. One should choose them wisely. Also, MS Excel provides an inbuilt function for all three, namely, AVERAGE, GEOMEAN, and HARMEAN respectively.
Now that the three definitions are out of the way, let us get back to the original question.
How to Combine Two Very Different Metrics
Let us use an example:
A business has calculated that the product families have the following characteristics.

The management wants to get to a composite metric so that they can easily compare the product families. How should an S&OP leader present this metric?
Geometric Mean comes to the rescue here. It can be used to compare things with very different properties. So, in this case, we find the geometric mean of the three metrics. See table below. Based on the geometric mean calculation, it seems product family 3 is the best (on account of the highest geometric mean).

This however could create a problem. While high Volume and Revenue are good, high customer count may be exactly the opposite, at least in some businesses. More customers can mean smaller shipments, more complaints, more complexity. If this is the case, what should the S&OP practitioner do?
One way to do this is to take the reciprocals of the customer count and then calculate the Geometric mean. See table below. Doing this makes it clear Product family 2 is the higher-ranked product family.

Another technique could be to reverse the direction of customer count by subtracting from the total customer count I am calling it Reverse Customer Count; if there is a better name for it, please let me know in the comments). Once done, the geometric mean can then be calculated the same way. See table below. This analysis suggests Product Family 2 is better placed to help the business, which is the same result we had when we took the reciprocal of the customer count above.

Apply Weights Before Combining
Often, there is a need to apply weights to different metrics before computing the combined number. This is easily done. Multiply the weights to the metrics before calculating the geometric mean.
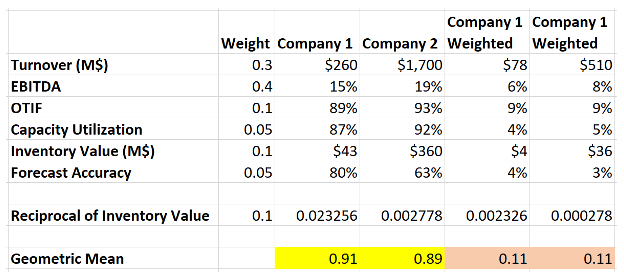
As an example, say we are comparing two competing companies. Say we have data for 6 different metrics for both companies.

As one can see from the yellow cells, company 1 seems better before applying weights; once the weights are applied, the two companies seem to be almost the same in the combined metric.
In summary, let me say that the supply chain practitioner must be aware of the right way of calculating the summary statistic (mean), be it arithmetic, geometric, or harmonic. And when it comes time to combining the different (and diverse) metrics into one number, one should use geometric mean.
Questions? Comments? Please share via comments.


