How does currency demonetization affect statistical forecasting?
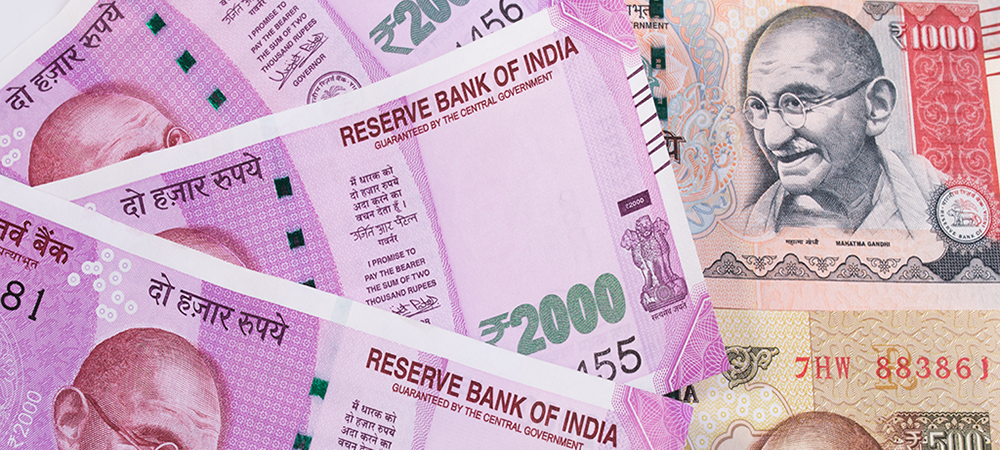
The Government of India recently enacted the policy to demonetize Rupees 500 and 1,000 banknotes. ( ₹500 and ₹1,000). All bank notes of these denominations ceased to be legal tender on November 9, 2016. A Google search on this will reap rich returns; here is an article on this topic on Wikipedia. The coverage for this has been robust, and I certainly do not want to just add more noise to it. However, I have now gotten a few queries from my clients/prospects about the best way to deal with this in their statistical forecasting process. I want to address that question here.
The basic question that I have been asked is this: We are seeing 20-40% decrease in sales volume in November/December because of demonetization. Thus, our statistical forecast engine is generating low forecasts for the future. We think this is not going to last. How should we handle this?
The key thing to remember in these situations is that this is a one-time event. (If on the other hand, one has some knowledge of this not being a unique event, then they probably could make a lot more money by betting on that knowledge; I would quit the forecasting profession and invest my time there). Back to the real world, though; If there is a strong reason to believe this event will not be repeated any time soon, then this downturn of demand can be treated as an outlier. And with this type of outlier where the event is known to be nonrepeatable, there is the need to think about removing the outlier.
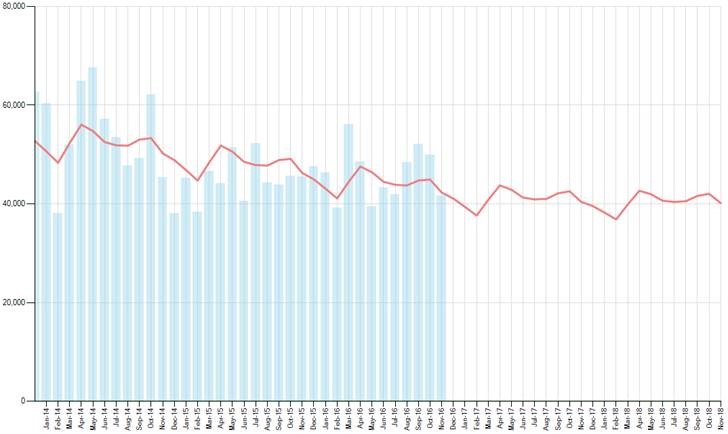
Look at the examples below. The first example is where the shipments (columns 0 were unaffected with the associated forecast (line)
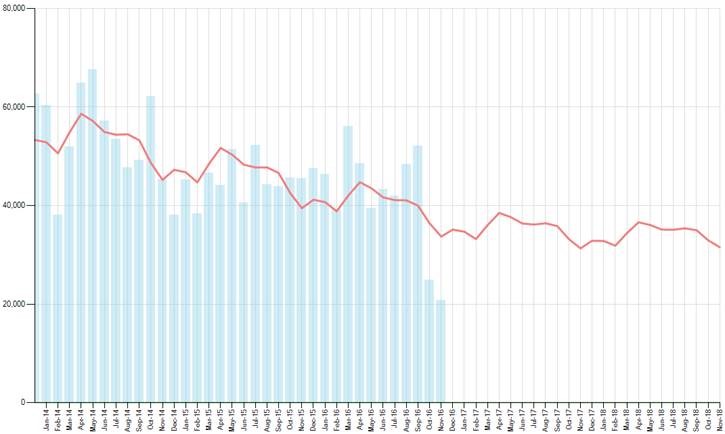
The second picture below is the same data series as above but the last two months have been artificially reduced to half their value. As one can quickly observe from the graph, the forecast goes down because of this unexpected downturn.
Removing Outliers in Forecasts
So, how to remove the outliers? Different software solutions have different ways of working with this.
Many commercial forecasting packages come with a method to remove the outliers. This might be a reasonable and the most cost effective approach if it is available to you.
One popular way is to mask the data in offending months. So, in this scheme, one thinks of October as the last real month of data and uses that to forecast January/February while ignoring November/December Actuals. This is a good technique; the one con with it is that one will lose seasonality related to November/December. In what is a very common setup, if one kept 36 months of history in the forecasting system, now they are effectively forecasting with 34 months of data, which leads to some loss in seasonality calculations as three full years of data is no longer available to the engine.
Another approach is to forecast using the data until October, and then use the forecast generated for November and December as the actuals in those months. This is also a reasonable approach.
Another approach is to remove outliers by adjusting the data for November/December. There are various ways of doing this.
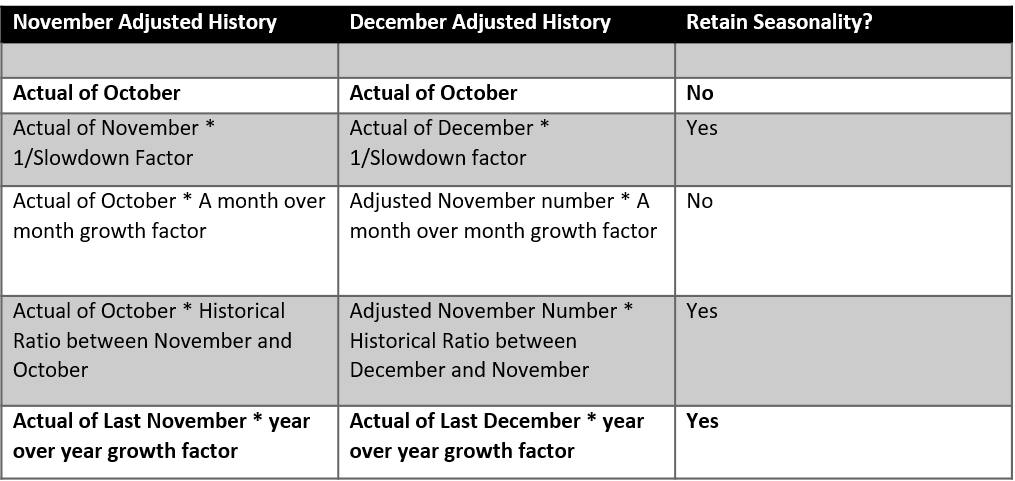
As far as recommendations go, I would recommend a simple approach. Either use an inbuilt method from the software package you are using, or use one of the methods highlighted in bold above.