
Supply Chain Planners in different roles look at their data at different levels. Demand planners may look at their forecast at product customer level whereas their managers may look at the forecast for a product group in a region. Planners in certain industries such as the consumer-packaged goods (CPG) prefer updating forecasts at an aggregate level but would also sometimes want to lock values at the detail level to prevent disaggregation to a specific combination. How is it done? A planning system is expected to present correct data to the planner at whatever level it is being looked at.
Let’s understand how a planning system aggregates and disaggregates data and then answer the CPG industry question.
Supply Chain Data Aggregation
Aggregation refers to a function using which given data at a detail level is aggregated to a higher level. For example, forecast at a product level or product-customer level is aggregated to a product family or product family-country level.
The aggregate function depends on the data. Sales, forecast, orders, revenue can be summed up whereas costs and price cannot be summed. To aggregate costs or prices, the average or weighted average should be used. Let’s see examples of aggregating forecast and price.
Read More: Tips for Optimizing Your Entire Supply Chain Planning Process
Let’s say there are 5 products (P1, P2, P3, P4, and P5) under one product family shipped to 3 customers (C1, C2, and C3). The table below has prices per product (column F) and forecast (column G) at product-customer level. Column H is Forecasted Revenue = Price x Forecast
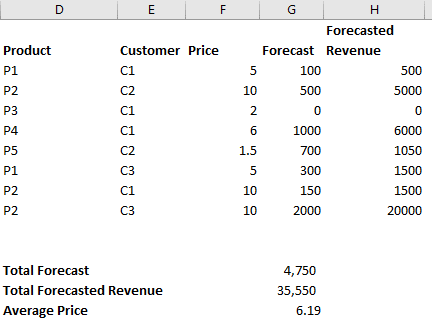
Total Forecast for the product family is nothing but the sum of detail level forecasts which is equal to 4,750. Similarly, the Total Forecasted Revenue at the product family level is 35,550.
Aggregating prices or costs using this simple average can be misleading. Here’s how.
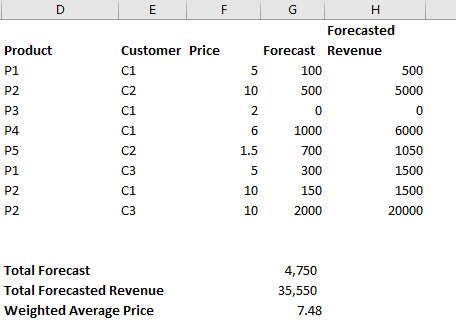
Using a simple average (average of column F), the price at product family level is 6.19. Another way to calculate the price at Product Family level is simply divide Total Forecasted Revenue by Total Forecast which is 35,550/4,750 = 7.48 which does not match with 6.19.
This is because 7.48 is weighted by forecast (and called weighted average price) whereas 6.19 is not weighted. 7.48 is the correct price at the product family level.
Supply Chain Data Disaggregation
Disaggregation refers to a function using which given data at an aggregated level, such as forecast for a region, is broken down to detail level such as a state. Disaggregation works on existing ratios at detail level data.
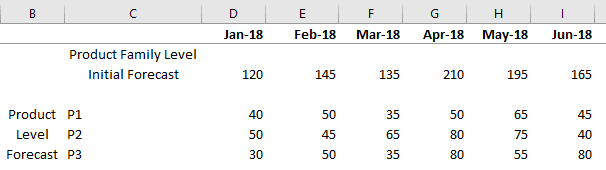
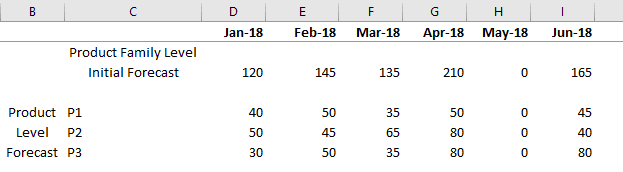
Here’s an example. Consider there are 3 products (P1, P2 & P3) under a product family. The total forecast at product family level and per product from Jan-18 to Jun-18 is given in the table.
Read More: How Do You Create a Consistent Data Basis for Planning?
Now if I adjust the product family level forecast, the following steps are followed in a planning system to adjust detail level i.e. product level forecast.
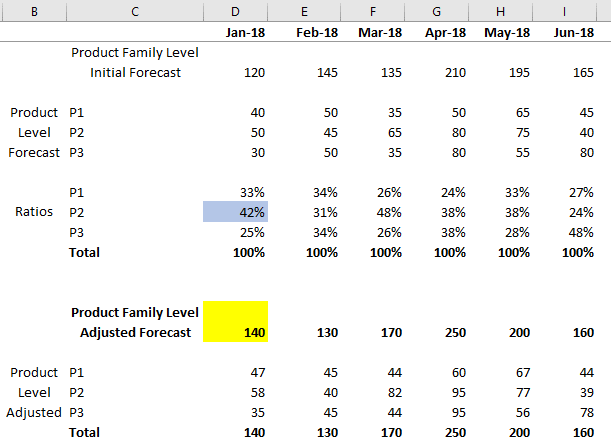
- The planning system calculates the ratio of a forecast of an individual product under the product family.
- For instance, for Jan-18 the ratio of P2 to the total forecast is 42% which is nothing but 50 divided by 120. See the below table.
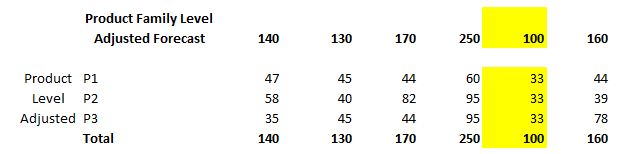
- When I adjust my product family level forecast to 140 the forecast of P2 changes from 50 to 58 which is nothing but ~ 42% of 140.
- Similarly, for P1 it changes from 40 to 47 (~33% of 140) and for P3 it changes from 30 to 35 (~25% of 140).
- Adding 58+47+35 = 140 i.e. adjusted forecast for Jan-18 is 140.
- Similarly, we can calculate the new disaggregated value of adjusted forecast for months from Feb-18 through Jun-18 based on the ratios of the initial forecast. See table below for the new disaggregated values of an adjusted forecast.
Special Case: What happens if the forecast at the product family level is 0 for some reason? Let’s assume an error in loading data for May-18 led to the forecast being 0.
Following table shows the ratios at the product level. Notice the system cannot calculate ratios for May-18.
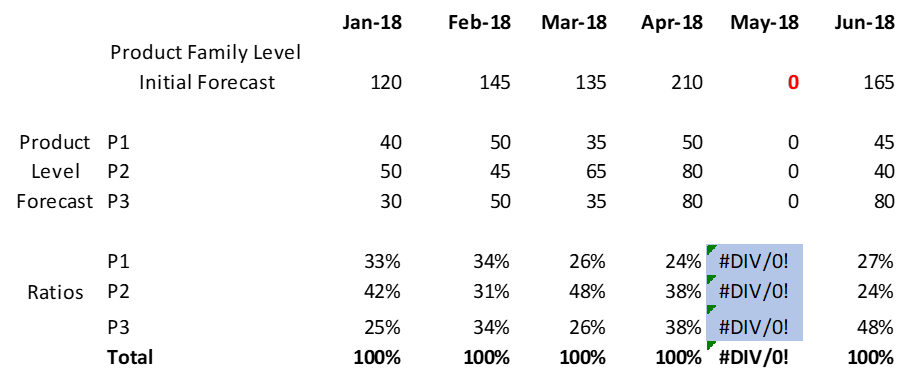
So, the forecast for all three products will be equally distributed. If the 0 is adjusted to 100 all products get ~33.
The planner can then adjust the product level forecasts to get better ratios. Then next time the product family level forecast is adjusted the data would account for these ratios and would disaggregate accordingly.
Coming back to the CPG industry business case mentioned at the beginning, in a company producing berries planners prefer to update the forecast at Product Group level and lock the forecast at Channel (retail, wholesale, food services, 3rd party etc.) where commitments have already been made. Supply Chain Planning software like Arkieva provides functionality to lock forecast at the detail level and prevent disaggregation.
Read More: Your Data is Only as Good as How You Visualize It
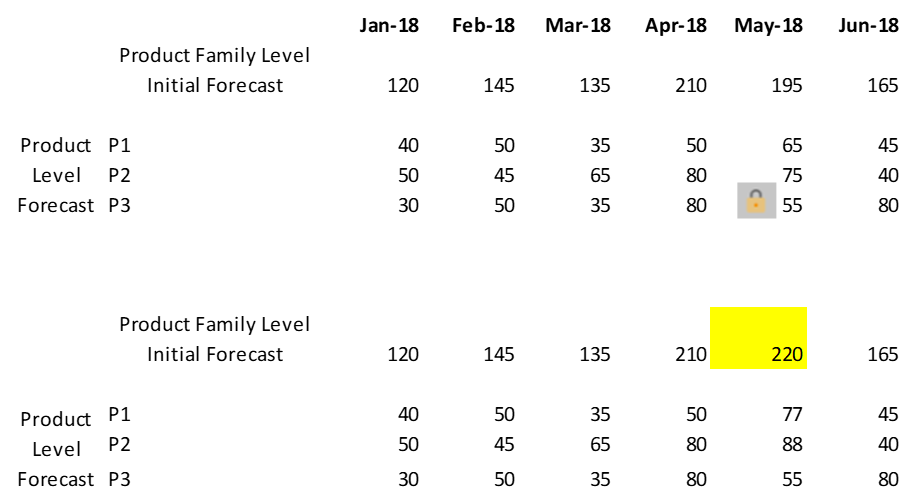
Here’s an example. Forecast at product family level for May-18 is 195. Planner decides to override it to 220 keeping the forecast of product P3 at 55. The lock feature allows forecast at P3 to be untouched at 55 while adjusting the forecast at P1 & P2 so that the total forecast at product family level remains 220. What this means is that the forecast for Product P1 and P2 increased by following the same disaggregation principle as discussed above.
Enjoyed this post? Subscribe or follow Arkieva on Linkedin, Twitter, and Facebook for blog updates.